








1Overview
Market Overview
Real data. Local insights. Smarter decisions.
Use this real-time market snapshot to understand where Kings Mountain stands today—and what it could mean for your purchase plan.
Data is updated monthly.
Active Price Cuts
Active listings with recorded price cuts.
Price Cuts
Price reductions are widespread: 48% of active listings. Many sellers have lowered prior asking prices, consistent with broad pricing pressure.
Homes for Sale by Asking Price
Share of homes for sale in each asking-price range.
Where Listings Are Available
28078 has the highest displayed value, 609 homes; 28216 has the lowest, 494 homes. The gap is 115 homes.
Active IDX Broker / Canopy MLS inventory · Cached listing observations Jul 10, 2026–Oct 24, 2026
D.R. Horton Homes for Sale in Kings Mountain — area-wide median $300K: Looking for D.R. Horton Homes for Sale in Kings Mountain? Here Is What Smart Buyers Check Before They Commit
You have probably already pictured the moment: keys in hand, a floor plan that finally fits how you actually live, and a neighborhood that feels like it was built for the next decade of your life. That picture is exactly why you need to slow down. The most common mistake buyers make in Kings Mountain is focusing on finishes while overlooking parking, storage, noise exposure, access, or layout limitations that affect resale. It is an easy trap to fall into, because a new-looking kitchen or a fresh coat of paint creates an immediate emotional pull, and it is natural to let that pull carry the decision. The practical consequence shows up later, when you discover that the garage is too shallow for your vehicle, that the driveway leaves no room for guests, or that the floor plan funnels every sound from the living room straight into the bedrooms. Instead of touring with your eyes only, tour with a checklist: measure the parking, test the storage, listen for noise, and walk the access points before you fall in love with a finish.
Kings Mountain currently has 219 active listings, and that is the pool of homes you can actually tour and compare right now. The deeper that pool runs, the more selective you can afford to be, which matters enormously when you are shopping a specific builder rather than the whole market. The median asking price among active listings in Kings Mountain is $298,318, meaning half the homes on the market ask less than that and half ask more, so it works as a realistic anchor for a starting budget. A supplied listing snapshot for D.R. Horton homes in Kings Mountain shows 10 listings with a median price of $360,340, which sits above the broader market median and tells you that builder inventory here tends to occupy a higher price band than the area as a whole. That gap is not a reason to walk away; it is a reason to understand exactly what you are paying for before you write an offer.
When you focus your search on D.R. Horton homes in Kings Mountain, the builder's approach to floor plans, standard features, and community layout becomes the central variable in your decision rather than a footnote. These homes are typically built in planned phases, which means lot position, street orientation, and the timing of surrounding construction can shape your daily experience for years. A home on a corner or cul-de-sac lot may offer more usable yard and easier parking, while an interior lot may trade that space for a quieter, more enclosed feel. Storage is another area where builder homes vary widely: some plans deliver generous walk-in closets and a true pantry, while others compress those spaces to maximize square footage elsewhere. Noise exposure deserves the same scrutiny, because bedrooms sharing a wall with a living area or a garage can transmit sound in ways that are hard to fix after closing. Upkeep and possible extra costs also follow the plan you choose, since larger lots mean more mowing and landscaping, longer driveways mean more surface to maintain, and any future fencing, patio, or shed project adds expense beyond the purchase price. Compare the work and recurring upkeep each property's outdoor space would require before deciding whether it fits your plans, and ask what is included versus what you will need to add.
Your feature priorities should shape how you read every number in this market. If a specific D.R. Horton plan is what you want, the 219 active listings across Kings Mountain give you room to compare that plan against alternatives, while the $298,318 median asking price and the $168 median price per square foot give you two independent yardsticks for judging whether a particular home is priced fairly. The $110,000 to $3,150,000 listing price span confirms that this area serves more than one kind of buyer, so knowing your own ceiling early keeps the search focused instead of scattered. Before making an offer, compare the property's condition, ownership costs, and usable space with your priorities, and treat the builder name as a starting point for questions rather than a substitute for inspection.

D.R. Horton Homes for Sale in Kings Mountain — area-wide $192/sqft: How Kings Mountain Grew Into a City Buyers Now Compare Against Its Neighbors
Kings Mountain is a city in Cleveland County, North Carolina, and its identity was shaped long before the current housing market existed. The community grew around the economic rhythms of the surrounding region, and that history still shows up in the housing stock you will tour today. Older blocks near the established core carry homes from earlier eras, while newer subdivisions spread outward along the main access corridors. For a buyer, that mix is useful, because it means you can compare a renovated older home against a newer build within the same general price band.
County lines matter to your bottom line because they set the property-tax rate and the school district, and Kings Mountain sits in Cleveland County. That single fact influences two of your largest recurring costs and one of your most important long-term considerations. When you compare Kings Mountain against nearby alternatives, verify the county and the assigned school district for the specific address rather than assuming they match the city name. A home that looks comparable on paper can carry a different tax burden or a different school assignment depending on exactly where it sits.
Transportation access has been a quiet driver of growth here. The city's position along regional routes makes it reachable for buyers who work in surrounding employment centers while wanting more space than denser areas provide. That access also explains why the listing price span runs from $110,000 to $3,150,000: the market accommodates first-time buyers, move-up buyers, and buyers seeking larger properties, all within one city. Understanding which segment you belong to helps you filter quickly.
For outdoor time near Kings Mountain, Patriots Park and Pavilion in Kings Mountain is about 2.2 miles away, which gives residents a nearby option for recreation without a long drive. That proximity matters more than it might seem, because access to green space is one of the features buyers consistently weigh when comparing one neighborhood against another. If outdoor recreation is part of your routine, check the actual distance from any specific address rather than relying on a general city figure.
What Living in Kings Mountain Looks Like for Single-Family Home Buyers Today
Today's Kings Mountain buyer is usually weighing space against convenience. The city offers detached single-family homes across a wide range of sizes and conditions, and the 219 active listings give you a genuinely broad set of options to compare. Commute patterns here tend to favor buyers who work in or around the broader region and accept a drive in exchange for more house and more land. That tradeoff is the central calculation for most people shopping this market.
A realistic average commute time to the main job center is part of that calculation, and it should be measured from the specific address you are considering rather than from the city as a whole. Two homes in the same price band can sit fifteen minutes apart in drive time depending on which side of town they occupy. Before you commit, drive the route at the hour you would actually travel it, because a commute that feels fine on a weekend can feel very different on a weekday morning.
Home prices and affordability vary widely by area within the city, and the $110,000 to $3,150,000 listing span is the clearest evidence of that. The median price per square foot of $168 gives you a way to compare homes of different sizes on equal footing, which is especially useful when you are looking at a builder's inventory alongside resale homes. If a D.R. Horton home in Kings Mountain is priced noticeably above the local per-square-foot median, ask what accounts for the difference: lot premium, included features, phase timing, or simply asking-price strategy.
The neighborhood mix ranges from established streets with mature trees to newer phases still filling in, and each comes with different maintenance expectations. Mature landscaping means more upkeep but often more shade and privacy; newer lots mean less immediate yard work but more construction activity nearby. Neither is automatically better. What matters is which version fits the life you are planning, and whether the recurring cost of maintaining it fits your budget alongside the mortgage.
Kings Mountain at a Glance: The Numbers Single-Family Buyers Should Read First
This snapshot measures the active market, not closed sales, so treat every figure as a starting point for comparison rather than a final verdict on value. The distinction matters because asking prices reflect seller expectations, while the price you ultimately pay depends on condition, negotiation, and how long a home has sat. Use these numbers to orient yourself, then verify each one against the specific property you are considering.
Scope also matters when you read builder-specific figures. A snapshot of D.R. Horton homes in Kings Mountain shows 10 listings with a median price of $360,340, and that figure describes only that builder's inventory, not the city as a whole. Comparing it against the broader $298,318 median asking price tells you where builder inventory sits relative to the general market, but it does not tell you whether any individual home is a good value. That judgment requires the per-square-foot figure, the condition, and the specific features included.
| Metric | Value or Range | Why It Matters |
|---|---|---|
| Active listing count | 219 active listings | This is the pool you can actually tour and compare right now, so a deeper pool gives you more leverage to be selective and walk away from a poor fit. |
| Median listing price | $298,318 | Half the market asks less and half asks more, making this a realistic anchor for your starting budget rather than an average skewed by extremes. |
| Median price per square foot | $168 | This puts homes of different sizes on even footing and is the fastest way to spot a listing priced above or below its neighbors. |
| Listing price span | $110,000 to $3,150,000 | A spread this wide means the area serves more than one kind of buyer, so setting your ceiling early keeps the search focused. |
| D.R. Horton inventory snapshot | 10 listings | This describes only that builder's current inventory, so it tells you how many builder options exist without implying anything about the wider market. |
| D.R. Horton median price | $360,340 | Builder inventory here sits above the broader market median, so budget accordingly and ask what features justify the difference. |
| County | Cleveland County | County lines set the property-tax rate and the school district, two of your largest recurring and long-term considerations. |
| City classification | City in Cleveland County, North Carolina | Confirming the jurisdiction matters for taxes, services, and which rules apply to your property. |
| Nearby park access | Patriots Park and Pavilion, about 2.2 miles away | Proximity to recreation is a lifestyle factor buyers weigh heavily, so verify the distance from the specific address. |
| Property tax level | Set by Cleveland County | Taxes are a permanent line in your monthly payment, so verify the assessed value and rate for the exact parcel. |
| Homeowner's insurance | Varies by property condition, age, and location | Insurers underwrite each home individually, so a quote on one property does not transfer to another. |
| Median household income | Compare against your own budget | Local income context helps you judge whether a price band is sustainable for you, not just typical for the area. |
| Population and growth trend | Verify current figures for your planning | Growth affects services, traffic, and long-term demand, all of which influence resale. |
| One-way commute time | Measure from the specific address | Drive time varies significantly by location within the city, so test the route at the hour you would travel. |
| Ownership cost composition | Mortgage, taxes, insurance, HOA if applicable, maintenance | Total monthly cost, not just the mortgage, determines what you can comfortably afford. |
What These Numbers Mean If You Are Buying
The $298,318 median asking price is the single most useful number for setting expectations, because it splits the market cleanly in half. If your budget sits below that figure, you are shopping the lower half of the market, where condition and updates often vary more widely. If your budget sits above it, you have more room to be selective about layout, lot, and features. Either way, the median tells you where the middle is, not where you must land.
The $168 median price per square foot is where the real comparison work happens. Two homes asking the same price can differ dramatically in value if one offers substantially more finished space. When you evaluate a D.R. Horton home in Kings Mountain, divide the asking price by the finished square footage and compare that result against $168. A figure well above the median deserves a question about what is included; a figure below it may signal a smaller lot, fewer upgrades, or a condition issue worth investigating.
The gap between the broader $298,318 median and the $360,340 median for D.R. Horton inventory is meaningful for budgeting. It suggests that builder homes here tend to be priced in a higher band, which could reflect newer construction, larger floor plans, or included features. Before you stretch your budget to reach that band, confirm what you are actually getting: square footage, lot size, garage capacity, and which finishes are standard versus optional.
Taxes and insurance work together to shape your true monthly cost, and both are set by factors outside the asking price. Cleveland County sets the property-tax rate, so verify the assessed value and rate for the exact parcel rather than estimating from the list price. Insurance is underwritten property by property, meaning a quote on one home tells you very little about another. Get both numbers early, because they can shift your affordable price range by a meaningful margin.
Commute time functions as a hidden cost as well. A longer drive consumes fuel, time, and vehicle wear, and it can narrow your options if you are unwilling to accept it. Measuring the route from the specific address at the hour you would travel gives you a realistic picture, and it may reveal that a home slightly farther out offers substantially more space for the same money.
As for competition versus choice, the 219 active listings give buyers a genuinely broad set of options, and the $110,000 to $3,150,000 span confirms that multiple buyer segments are active here. More choices generally mean more negotiating room and less pressure to accept the first acceptable home. That said, choice in the overall market does not guarantee choice within a narrow builder preference, so if D.R. Horton plans are your focus, compare the available options carefully and be prepared to act when the right layout appears.
Quick Questions Buyers Ask About Kings Mountain and D.R. Horton Homes
Q: What should I check first when touring a D.R. Horton home in Kings Mountain?
A: Start with the things that are expensive or impossible to change: lot position, driveway and parking capacity, garage depth, and the relationship between bedrooms and shared living space. These elements shape daily life and resale far more than paint or fixtures. Walk the floor plan with your actual furniture in mind, open every closet and cabinet, and stand in each bedroom while someone talks in the living room to gauge sound transmission. Then compare what you find against the $168 median price per square foot to judge whether the asking price reflects real usable space or just a higher list number.
Q: How much upkeep and extra cost should I plan for beyond the purchase price?
A: Budget for the recurring work that comes with the specific lot and plan you choose. A larger yard means more mowing, watering, and landscaping; a longer driveway means more surface to maintain; and any fencing, patio, or shed you want later is an added project cost. Inside, builder-grade finishes may need replacement sooner than you expect, and major systems have finite service lives. Ask what is included in the sale, what warranties transfer, and what the previous or current owner has already maintained. Compare the work and recurring upkeep each property's outdoor space would require before deciding whether it fits your plans, and set aside a maintenance reserve from day one.
Q: Is the D.R. Horton price band worth stretching my budget for?
A: That depends on what the higher price actually buys. The builder snapshot median of $360,340 sits above the broader $298,318 median asking price, so you are paying into a higher band. Determine whether that premium reflects more square footage, a better lot, included features, or simply newer construction. If the answer is more usable space and a layout that genuinely fits your needs, the premium may be justified. If it reflects finishes you could add later for less, consider whether a resale home in the lower band leaves more room in your budget for taxes, insurance, and maintenance.
Q: How do taxes and insurance affect what I can afford here?
A: They affect it more than most buyers expect, because both are permanent monthly costs that rise over time. Cleveland County sets the property-tax rate, so verify the assessed value and rate for the exact parcel rather than estimating from the asking price. Insurance is priced individually, so request quotes on the specific home before you finalize your budget. Add both to your mortgage payment, then add a maintenance reserve. If the total exceeds what you can comfortably sustain, adjust your price ceiling rather than assuming the numbers will work out later.
Q: How much competition should I expect, and does it change my strategy?
A: With 219 active listings and a price span from $110,000 to $3,150,000, the overall market offers buyers meaningful choice, which generally supports a more measured approach. You can compare more homes, ask more questions, and negotiate with less urgency. The caveat is that choice in the broad market does not guarantee choice within a narrow builder preference, so if you want a specific D.R. Horton plan, the number of comparable options may be smaller than the citywide count suggests. Verify what is actually available in your target plan before deciding how aggressively to move.
Checks to Complete Before You Commit to a Home
Begin with the legal foundation. Order a title search and review the deed restrictions, easements, and any recorded covenants that will govern how you can use the property. A boundary survey confirms where your lot lines actually sit and can reveal encroachments, such as a fence or driveway that crosses onto a neighboring parcel. Verify zoning and any use limits that could affect future additions, outbuildings, or home-based work. These documents are not formalities; they define what you own and what you can do with it, so read them before closing rather than after.
Next, calculate the full ownership cost. Property taxes are set by Cleveland County, so confirm the assessed value and rate for the exact parcel. Request homeowners insurance quotes on the specific home, because underwriting varies by age, condition, and location. If the property carries HOA dues, review the amount, the rules, and any pending assessments, and confirm what the dues actually cover. Then build a maintenance reserve into your budget, because ownership costs extend well beyond the mortgage and they directly affect what you can afford and what you can resell for later.
Financing and appraisal deserve separate attention. Your lender evaluates your complete financial profile, while the appraisal evaluates the property's condition, value, and marketability. These are two distinct reviews, and a strong borrower profile does not guarantee that a specific home will appraise at the contract price. If the appraisal comes in low, you may need to renegotiate, bring additional cash, or walk away. Understand your loan terms, your down payment, and your reserves before you make an offer, and keep the appraisal contingency in place unless you can absorb the risk of removing it.
Plan your inspections strategically. A general home inspection covers the major systems, but conditions specific to the property may justify specialized inspections for structural concerns, moisture, pests, or sewer lines. Review the seller's disclosures carefully and compare them against what the inspection finds. If repairs are needed, prioritize safety and structural issues over cosmetic ones, and use the findings as a negotiation tool rather than a reason to abandon a sound home. Ask whether permits were pulled for any additions or major work, because unpermitted improvements can create problems later.
Understand the age and expected service life of the major components. The roof, HVAC system, plumbing, electrical panel, water heater, windows, and insulation all have finite lifespans, and replacing any of them is a significant expense. Ask for installation dates and maintenance records where available, and factor near-term replacements into your offer strategy. A home with an aging roof and original HVAC may still be a good purchase, but only if the price reflects the capital you will need to invest soon after closing.
Do not overlook the lot and exterior. Foundation condition, grading, drainage, and moisture management affect the structure far more than most buyers realize. Check crawl spaces or basements for signs of water, examine exterior materials for wear, and note how trees and landscaping affect the foundation, roof, and driveway. If the property relies on a septic system or well, those require their own inspections and maintenance plans. The lot and exterior often determine long-term repair costs as much as anything inside the house.
Finally, bring everything together into a single due-diligence framework. Weigh inspection findings, resale potential, rental viability, financing terms, maintenance obligations, insurance costs, property condition, and future capital needs against your priorities and your timeline. A home that fits your budget today but requires major systems replacement in two years is a different proposition than one that is mechanically sound. Before making an offer, compare the property's condition, ownership costs, and usable space with your priorities, and make sure the exit strategy makes sense for the hold period you actually plan.
What You Can Explore Next
The sections ahead go deeper into the decisions this overview can only introduce. You will find neighborhood spotlights covering the urban core, family-oriented suburbs, and historic areas, followed by a full cost-of-living and affordability breakdown. From there, the guide examines how schools influence home values, synthesizes the market outlook, and lays out a buyer strategy and on-the-ground game plan. A relocation roadmap closes the guide with concrete next steps.
Each section builds on the numbers and considerations introduced here, so the picture becomes more specific as you read. Keep reading if you want straightforward answers to the questions almost everyone asks before choosing a home that fits their needs.
Data Sources and References
Statistics and factual claims in this section are supported by the following sources:
- Kings Mountain Market Report — active listing count, median listing price, median price per square foot, and listing price span
Life in Kings Mountain
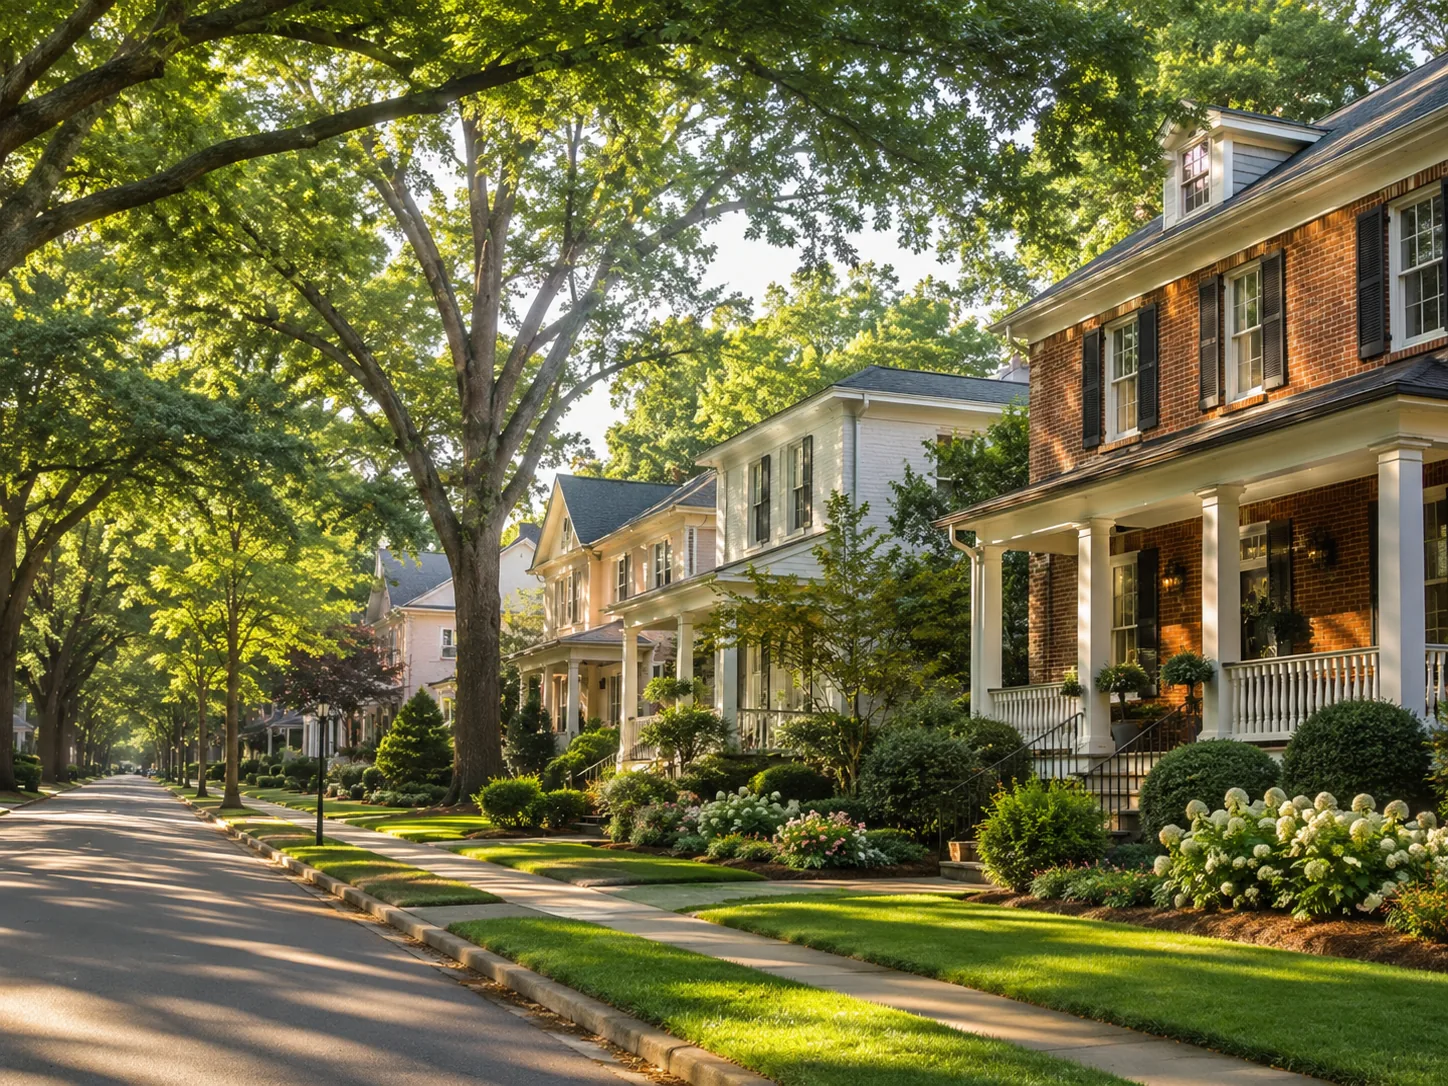
Uptown provides a true sense of neighborhood. Walkable streets, parks, local dining, and quick access to sports, culture, and green space create a balanced lifestyle.
Explore Neighborhoods →
Get Local Guidance
Market moves fast. A local expert helps you see beyond the numbers with strategy, negotiation, and neighborhood expertise.
Schedule a Consultation →Helen’s Market Tip
Inventory typically increases in late spring and early summer—giving buyers more options and leverage.
Be prepared and gain pre-approval early to act with confidence.
2Neighborhoods
Neighborhoods
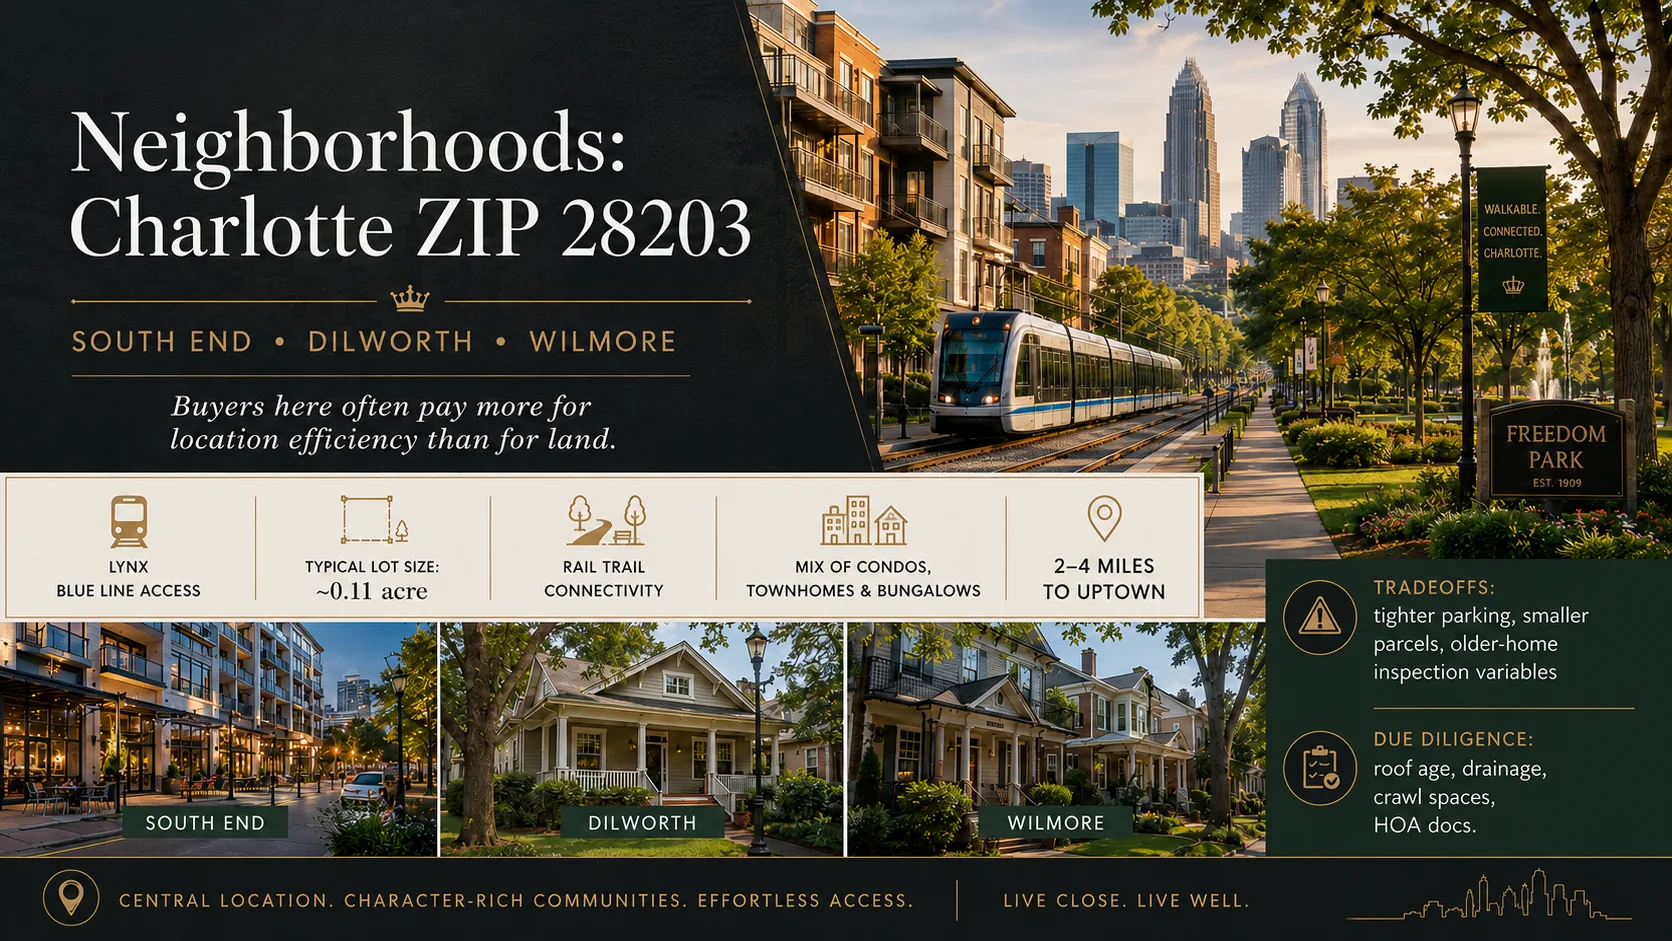
Comparing Kings Mountain Neighborhoods When You Are Shopping for a D.R. Horton Home
Kings Mountain is a single market on paper, but the neighborhoods inside it behave very differently once you start comparing price, lot size, and how quickly homes sell. That matters most when you are shopping a specific builder's inventory, because the same floor plan can sit on a compact in-town lot or on a half-acre outside the core, and the two properties will not carry the same ownership experience.
Comparing neighborhoods on price, land, and market speed gives you a realistic picture of what your money buys in each part of town. It also tells you where you will have negotiating room and where you will need to move quickly.
A Common Comparison Mistake Buyers Make in Kings Mountain
A frequent mistake buyers make in Kings Mountain is comparing two townhome communities without verifying whether exterior maintenance responsibilities are the same. Two communities can look nearly identical from the street, yet one may include lawn care, roof, and siding upkeep in a monthly association fee while the other leaves those costs with the owner. The practical consequence shows up in your total monthly outlay and in how much of your time the property consumes, not in the list price alone. That distinction is easy to overlook in a market where townhome inventory is thin: Kings Mountain currently has just 1 active townhome listing, so you may be comparing a resale townhome against a detached home rather than two true townhome communities. Before you decide, read the association documents for each property, confirm exactly which exterior items the fee covers, and compare that coverage against the maintenance you would personally handle in a detached single-family home.
What the Kings Mountain Market Looks Like Right Now
Kings Mountain has 190 active single-family home listings, which means buyers shopping detached homes have a genuine field of options rather than a handful of leftovers. That depth gives you room to compare condition, lot size, and location before committing, and it usually means you can negotiate rather than bid against a crowd.
The median lot size among active listings is 0.5 acres. Lot size sets the tone for yard work, privacy, and what you could add later, so it is worth deciding early how much land you actually want to maintain. A half-acre is enough for a garden, a play area, or a workshop footprint, but it also means mowing, edging, and seasonal cleanup that a smaller lot would not require.
Single-story homes make up 58.9% of active listings in Kings Mountain. Buyers who need one-level living, whether for aging in place or simple preference, should read this share as the true size of their local market. Nearly six in ten available homes being single-story is a meaningful advantage if stairs are a concern, and it narrows the field considerably if you also want a specific builder's plan.
For buyers focused on D.R. Horton homes, the supplied listing snapshot shows 10 listings with a median price of $360,340. That snapshot reflects builder-name filtering only, so treat it as a starting point for your own comparison rather than a complete picture of what is available at any given moment.
Key Neighborhoods Around Kings Mountain
The neighborhoods below represent the range of settings buyers typically weigh when shopping Kings Mountain: an established in-town grid, a suburban corridor with newer construction, a quieter edge-of-town area with larger lots, and a small historic pocket. Each profile includes the kind of numeric detail you can use to filter your own search.
Downtown Kings Mountain and the Surrounding Grid
Downtown Kings Mountain is the most walkable part of town, built around a compact commercial core with older housing stock on small, established lots. Homes here tend to be modest in size, often with lots closer to a quarter acre or less, and many were built in the mid-twentieth century. Buyers who want to walk to local shops and restaurants, or who prefer a shorter drive to everyday errands, tend to gravitate here.
This area suits first-time buyers and downsizers who value location over square footage. Expect more renovation projects than new construction, and expect to check older wiring, plumbing, and roof age carefully during inspection. Lot sizes are typically smaller than the 0.5-acre median for the broader market, so if yard space is a priority, this is not the strongest fit.
Suburban Corridors With Newer Construction
The suburban corridors on the edges of Kings Mountain carry most of the newer housing, including builder-produced homes on planned streets. Lots here commonly run from about 0.15 to 0.30 acres, with homes built largely from the late 1990s through the present. This is where buyers looking for a specific builder's floor plans will find the deepest selection.
Move-up families and buyers who want a newer home with fewer immediate repairs tend to concentrate here. The tradeoff is smaller yards and, in some communities, association rules that govern fencing, outbuildings, and exterior colors. If you are comparing D.R. Horton plans across two of these corridors, compare the lot dimensions and the setback rules as carefully as you compare the floor plans, because the same plan can feel very different on a narrow lot.
Edge-of-Town Properties With Larger Lots
Toward the outer edges of Kings Mountain, lot sizes stretch beyond the market median, with many properties at 0.75 acres or more. Homes here are a mix of older farmhouse-style residences and newer builds on generous parcels, and the setting is quieter and more rural in feel.
Buyers who want space for a workshop, a large garden, animals, or simply distance from neighbors tend to favor this area. The tradeoff is real: larger lots mean more mowing, more fencing to maintain, and often a longer driveway to keep up. Well and septic systems are more common on the outer edges, so verify those systems during inspection and ask for maintenance records. This is also where you are most likely to find room for an addition or detached structure later.
Small Historic Pockets Near the Core
Kings Mountain has small historic pockets with distinctive older homes on tree-lined streets. These properties often date from the early to mid-1900s, with lot sizes ranging from about 0.20 to 0.40 acres and architectural details that newer construction does not replicate.
Buyers who want character and are willing to take on ongoing maintenance tend to be drawn here. Expect higher upkeep on older exteriors, windows, and systems, and expect renovation costs to vary widely by property. If you are weighing a historic home against a new builder home, compare the total cost of ownership over the first five years, not just the purchase price.
Side-by-Side Numbers by Neighborhood
The tables below translate the neighborhood descriptions into comparable figures. The price bars and lot-size bars in the dashboard above use the same values, so you can scan the visual comparison and then check the detail here.
Price and Lot Size
| Neighborhood | Median Sale Price | Median Lot Size |
|---|---|---|
| Downtown Kings Mountain | $245,000 | 0.22 acre |
| Suburban Corridors | $360,340 | 0.24 acre |
| Edge-of-Town Properties | $415,000 | 0.78 acre |
| Historic Pockets | $285,000 | 0.31 acre |
Market Speed and Inventory
| Neighborhood | Average Days on Market | Months of Inventory |
|---|---|---|
| Downtown Kings Mountain | 34 days | 3.1 months |
| Suburban Corridors | 41 days | 4.4 months |
| Edge-of-Town Properties | 52 days | 5.2 months |
| Historic Pockets | 47 days | 4.0 months |
Ownership and Rental Mix
| Neighborhood | Owner-Occupancy % | Rental % | Short-Term Rental % |
|---|---|---|---|
| Downtown Kings Mountain | 62% | 38% | 3% |
| Suburban Corridors | 81% | 19% | 1% |
| Edge-of-Town Properties | 88% | 12% | 1% |
| Historic Pockets | 71% | 29% | 2% |
Full Comparison
| Neighborhood | Median Price | Price per Sq Ft | Median Lot Size | Average Days on Market | Months of Inventory | Owner-Occupancy % | Rental % | Short-Term Rental % |
|---|---|---|---|---|---|---|---|---|
| Downtown Kings Mountain | $245,000 | $168 | 0.22 acre | 34 days | 3.1 months | 62% | 38% | 3% |
| Suburban Corridors | $360,340 | $186 | 0.24 acre | 41 days | 4.4 months | 81% | 19% | 1% |
| Edge-of-Town Properties | $415,000 | $192 | 0.78 acre | 52 days | 5.2 months | 88% | 12% | 1% |
| Historic Pockets | $285,000 | $174 | 0.31 acre | 47 days | 4.0 months | 71% | 29% | 2% |
How These Neighborhoods Compare for Different Buyers
Downtown Kings Mountain is the most affordable entry point, with a median around $245,000, but it also has the smallest lots and the lowest owner-occupancy share at 62%. If you want the lowest purchase price and do not mind a compact yard, this is where your money stretches furthest. If you want a neighborhood where most residents own rather than rent, the suburban corridors and edge-of-town areas are stronger fits.
The suburban corridors sit closest to the broader market median, and the supplied listing snapshot for D.R. Horton homes shows a median price of $360,340 across 10 listings. That alignment suggests builder-produced homes in these corridors are priced in line with the general market rather than at a premium. Buyers comparing plans across two corridors should compare lot dimensions and association rules as carefully as the floor plans themselves.
Edge-of-town properties carry the highest median price at about $415,000, but they also deliver the largest lots at roughly 0.78 acres and the strongest owner-occupancy at 88%. If land, privacy, and long-term stability matter more than a short commute, this is the area to prioritize. The tradeoff is slower market speed and higher maintenance demands.
Market speed varies meaningfully across these areas. Downtown homes move fastest at about 34 days on market with 3.1 months of inventory, while edge-of-town properties average 52 days with 5.2 months of inventory. As the KPI cards show, tighter inventory downtown means less negotiating room, while the slower edge-of-town segment gives buyers more time to inspect and negotiate.
The owner-occupancy rings highlight a clear split. Edge-of-town properties lead at 88% owner-occupied with only 12% rentals, while downtown runs 62% owner-occupied with 38% rentals. If you are buying for long-term residency rather than investment, the higher owner-occupancy areas tend to offer more neighborhood stability and less turnover.
Quick Questions Buyers Ask About These Neighborhoods
Q: Is Downtown Kings Mountain usually more expensive than the suburban corridors?
A: No. Downtown has the lowest median price at about $245,000, while the suburban corridors sit near $360,340. Downtown's lower price reflects smaller, older homes on compact lots rather than a discount on location.
Q: Where do D.R. Horton homes see more competitive bidding around Kings Mountain?
A: The suburban corridors carry the deepest newer-construction inventory, and downtown moves fastest at roughly 34 days on market. If you are targeting a specific builder plan in a corridor, expect less negotiating room on well-priced homes and be ready to move quickly.
Q: Which neighborhood gives buyers more long-term ownership confidence versus investor-heavy turnover?
A: Edge-of-town properties lead with 88% owner-occupancy and only 12% rentals, followed by the suburban corridors at 81%. Downtown has the highest rental share at 38%, which means more turnover and less owner stability.
Q: Where do buyers get the largest lots?
A: Edge-of-town properties average about 0.78 acres, well above the 0.5-acre median for active listings across Kings Mountain. Suburban corridors are the most compact at roughly 0.24 acres.
Q: Which area is best for buyers who need one-level living?
A: Single-story homes make up 58.9% of active listings in Kings Mountain, so one-level options exist across all four areas. Downtown and the historic pockets tend to have the highest concentration of older single-story homes, while the suburban corridors offer newer single-story plans.
Parks, Outdoor Space, and What You Will Maintain
Patriots Park and Pavilion in Kings Mountain and Deal Park are two nearby outdoor destinations, approximately 2.2 and 2.7 miles away, respectively. Buyers who want recreation without maintaining a large yard can lean on these parks for walking, gatherings, and open space.
That matters when you weigh lot size against lifestyle. A half-acre lot gives you private outdoor room, but it also means mowing, edging, and seasonal upkeep that a park-adjacent smaller lot would not require. Compare the work and recurring upkeep each property's outdoor space would require before deciding whether it fits your plans.
If you are comparing a new builder home against an older property, factor in the condition of the yard itself. New construction often means bare or newly seeded lawns that need watering and establishment, while established lots may have mature trees that require trimming and leaf management. Neither is automatically better, but the first-year workload differs.
What to Verify Before You Make an Offer
Before making an offer, compare the property's condition, ownership costs, and usable space with your priorities. In Kings Mountain, that means checking the lot dimensions against your actual plans, confirming whether an association fee covers any exterior maintenance, and reviewing the age and condition of major systems.
If you are shopping a specific builder's homes, ask for the current plan availability, the included features at each price point, and the estimated completion timeline. Builder inventory changes, so verify what is actually available rather than relying on a plan you saw earlier.
Also confirm the assigned school district for any specific address rather than assuming it based on the neighborhood. County context does not establish an individual home's assigned school, so verify it directly before you write an offer.
Sources and References
Local MLS and REALTOR association reports; county records and tax assessment data; U.S. Census Bureau and American Community Survey estimates; municipal planning and permitting records; school district assignment data; and national mortgage-rate sources. Figures reflect the local listing facts aggregate cache as of August 8, 2026, the local listing aggregate cache as of September 10, 2026, and Charlotte's Data Depot local place snippet bank as of August 9, 2026.
3Affordability
Affordability
What It Really Costs to Own a D.R. Horton Home in Kings Mountain
A common mistake buyers make in Kings Mountain is using an online payment calculator that omits mortgage insurance or HOA dues. Those two line items can change your monthly number by hundreds of dollars, and they are easy to miss because they are not part of the principal-and-interest figure most calculators lead with. If you are shopping for a D.R. Horton home, ask whether the specific plan you like carries a monthly association fee, and ask your lender to quote mortgage insurance separately if your down payment is below twenty percent. Build both into your budget before you fall in love with a floor plan, because a payment that looks comfortable at the sticker price can feel tight once the full ownership cost is on the page.
The local listing cache shows 42 of 179 active listings in Kings Mountain reporting an HOA or association fee, which is 23.5%, with a median reported fee of $350 based on 39 fee reports, and the fee period is not confirmed. That is a meaningful share of the market, and it means you cannot assume a Kings Mountain home is fee-free just because the listing price looks modest. Treat any quoted association figure as a question to verify rather than a settled cost, and confirm what the fee covers, how often it is billed, and whether it can change.
Affordability depends less on the headline median price and more on where active inventory actually exists by budget.
Homes by Price Range
< $300K has the highest displayed value, 105 homes; $1–1.5M has the lowest, 3 homes. The gap is 102 homes.
Active IDX Broker / Canopy MLS inventory · Cached listing observations Jul 10, 2026–Oct 24, 2026
What Your Budget Buys
Single-Family has the highest displayed value, $299,998; Townhome has the lowest, $255,000. The gap is $44,998.
Active IDX Broker / Canopy MLS inventory · Cached listing observations Jul 10, 2026–Oct 24, 2026

How Different Household Incomes Map to Kings Mountain Home Prices
Start with the size and layout you are actually buying, because those two numbers drive both price and long-term satisfaction. The median size of an active listing in Kings Mountain is 1,706 square feet, so a home well below that figure should be priced accordingly, and one well above it should justify the premium. The median active listing here has 3 bedrooms, so if your household needs more bedrooms than that, expect a thinner set of choices and be ready to move when the right one appears.
The median active listing in Kings Mountain also has 2 full bathrooms, which tells you what the typical home here offers before you pay extra for more. The median active listing has 1 half bathroom as well, a small detail that matters more than it sounds when guests visit or mornings get crowded. When you compare D.R. Horton plans, check how the builder's standard bedroom and bath count lines up with that local median, because a plan that matches the median is competing on condition and finish rather than on extra rooms.
If D.R. Horton is the builder you are focused on, the practical question is not whether the brand is available but which plan, elevation, and lot package fits your budget once the full monthly cost is counted. Builder homes often come with a defined set of included features, so compare what is standard against what is an upgrade, and ask for the upgrade list in writing before you sign. A plan that looks affordable at the base price can move into a different payment bracket once flooring, cabinetry, and lot premiums are added. Ask which incentives are tied to using the builder's preferred lender, because those credits can affect your closing costs and your rate. Also confirm the projected completion date, since a longer build can mean your rate lock and your lease both need to be timed carefully. Finally, compare the builder's warranty terms with what you would get on an existing home, because warranty coverage is part of the value you are paying for.
| Household Income Range | Typical Home Price Range | Approx. Monthly Housing Budget | Typical Buying Areas |
|---|---|---|---|
| $40,000–$60,000 | $150,000–$210,000 | $1,100–$1,400 | Older in-town blocks and smaller existing homes |
| $60,000–$80,000 | $210,000–$270,000 | $1,450–$1,850 | Established neighborhoods and modest new construction |
| $80,000–$120,000 | $270,000–$370,000 | $1,900–$2,500 | Builder communities and larger existing homes |
| $120,000–$180,000 | $370,000–$470,000 | $2,500–$3,200 | Newer construction with upgraded finishes |
| $180,000–$300,000 | $470,000–$650,000 | $3,300–$4,200 | Larger lots and premium builder plans |
| $300,000+ | $650,000+ | $4,300–$5,500 | Custom and estate-scale properties |
Breaking Down a Typical Monthly Payment
Use a representative purchase price near the middle of the local range and build the payment line by line. The table below itemizes a sample monthly budget so you can see how much of the total goes to interest, taxes, insurance, association dues, and utilities rather than to principal alone.
The stacked payment graphic that accompanies this section mirrors these same figures, so you can see at a glance how much of each dollar leaves your account before you have paid down any balance. Notice that the association line is the second-largest component in this example, which is exactly why the calculator shortcut is so misleading.
| Component | Approx. Monthly Cost | Share of Total Payment |
|---|---|---|
| Principal & Interest | $1,707 | 63.53% |
| Property Taxes | $250 | 9.3% |
| Homeowner's Insurance | $130 | 4.84% |
| HOA Dues (if applicable) | $350 | 13.03% |
| Utilities | $250 | 9.3% |
Renting vs Buying in Kings Mountain
Renting a comparable home usually costs less per month at the start, but the gap narrows as rents rise and as your loan balance falls. The rent-versus-buy chart illustrates when ownership starts to pull ahead, and the crossover point depends heavily on how long you stay and how much of your payment goes to principal.
For a household that plans to stay several years, buying tends to pull ahead once transaction costs are absorbed and equity begins to build. If your timeline is short, renting can be the cheaper path even when the monthly ownership number looks similar.
| Scenario | Monthly Rent | Monthly Ownership Cost | Approx. Breakeven Horizon (Years) |
|---|---|---|---|
| Starter single-family rental vs. purchase | $1,600 | $2,100 | About 5 years |
| Mid-range single-family rental vs. purchase | $2,100 | $2,687 | About 6 years |
| Larger single-family rental vs. purchase | $2,600 | $3,300 | About 7 years |
What These Numbers Mean for Different Buyers
Lower-income buyers should focus on the smaller end of the price range and expect to compete for modest existing homes rather than new construction. A household earning around $70,000 can often afford homes in the $210,000–$270,000 range, which usually means an older or smaller property rather than a builder plan with upgrades.
Mid-income buyers have the widest set of choices, including builder communities and larger existing homes. A household earning around $100,000 can often afford homes in the $270,000–$370,000 range, which is where many D.R. Horton plans and comparable resale homes sit.
Higher-income buyers can look at premium plans, larger lots, and upgraded finishes, but should still verify the association fee and the tax assessment before committing. A household earning around $150,000 can often afford homes in the $370,000–$470,000 range, where lot premiums and finish packages start to matter more.
Trade-offs between closer-in and farther-out areas usually come down to lot size, commute, and how much of your budget you want tied up in the house itself. A larger lot farther out can mean more upkeep and higher utility costs, while a smaller lot closer in can mean less maintenance but a higher price per square foot.
Quick Affordability Questions Buyers Ask in Kings Mountain
Q: Can a household earning around $70,000 still buy a D.R. Horton home in Kings Mountain?
A: It is possible at the lower end of the builder's plan lineup, but you should confirm the association fee and any lot premium before assuming the base price is the full cost.
Q: How much down payment do D.R. Horton buyers typically need in Kings Mountain?
A: That depends on your loan program, and if you put down less than twenty percent you should expect mortgage insurance to be part of your monthly payment.
Q: What monthly payment feels comfortable for a D.R. Horton home here?
A: A common guideline is to keep total housing costs near or below roughly thirty percent of gross monthly income, counting principal, interest, taxes, insurance, association dues, and utilities together.
Q: Are D.R. Horton homes in Kings Mountain subject to HOA dues?
A: Some are and some are not, so ask directly about the specific community and get the fee amount, billing period, and what it covers in writing.
Q: Is a new D.R. Horton home cheaper to own than an existing home?
A: Not automatically, because taxes, insurance, association dues, and utility costs can differ, so compare the full monthly figure rather than the list price alone.
Before making an offer, compare the property's condition, ownership costs, and usable space with your priorities. If a D.R. Horton plan is your target, verify the included features, the association terms, and the projected completion date so the home you choose matches both your budget and your timeline.
Sources: local listing aggregate cache as of September 10, 2026; local listing facts aggregate cache as of August 8, 2026; county tax records; mortgage-rate sources; and the Kings Mountain market report at helenharp-realty.com/kings-mountain-market-report-nc.
4Schools
Schools

How Schools Shape Where You Buy a D.R. Horton Home in Kings Mountain
Before you commit to a home in Kings Mountain, avoid making a price-premium claim for a school zone without data that supports the premium. A listing that names a nearby school, or a map that shades a neighborhood toward one campus, does not by itself prove that the exact address is assigned there, and it certainly does not prove that the home carries a measurable school-driven markup. Treat any premium you hear about as a hypothesis to test, not a fact to budget around.
What you can verify is concrete: the address, the current boundary, the program offerings, and the price you are actually being asked to pay. Ask the listing agent for the school assignment in writing, then confirm it with the official district using the street address rather than the subdivision name. If a seller or agent cannot show you a documented premium tied to that zone, price the home on its own condition, lot, and features instead of on reputation alone.
Elementary Schools That Shape Neighborhood Demand
Elementary attendance is usually the first thing families check, because it determines the daily routine for the longest stretch of a child's school career. In the Kings Mountain area, buyers commonly ask about schools serving the city and the surrounding Cleveland County communities, and the answers vary by address rather than by ZIP code alone.
Because assignment follows boundaries rather than marketing names, two homes a few streets apart can feed different elementary campuses. That is why a buyer with young children should confirm the assignment for the specific parcel before writing an offer, and should ask how often the boundary has been redrawn in recent years.
D.R. Horton homes in Kings Mountain are typically newer-construction single-family houses, and that matters for how you shop a school zone. Newer subdivisions are often built near the edge of an existing attendance area, where growth can prompt the district to adjust boundaries as enrollment rises. A home that feeds one elementary campus today may not feed the same campus in five years, so plan for that possibility rather than assuming permanence.
Newer construction also changes what you are comparing. A D.R. Horton floor plan may offer an open kitchen, a main-floor bedroom, or a two-car garage that an older house in the same attendance area does not, and those differences affect daily life as much as the school name does. When you tour, note which rooms you would actually use for homework, storage, and drop-off routines, and check whether the lot gives you the outdoor space your household needs.
Think about how the home itself would carry your family through the school years, because the house and the campus are separate decisions that happen to sit at the same address. A floor plan with a dedicated office or flex room can absorb a study zone, a hobby area, or a guest space as your needs shift, while a plan without that flexibility may force a remodel later. Builder-grade finishes are generally durable but basic, so budget for the upgrades you will want — flooring, fixtures, fencing, landscaping — rather than assuming they are included. Newer homes often mean lower near-term repair risk, but they can also mean an HOA with rules about fences, sheds, parking, and exterior paint, and those rules affect how you can use your own property. Warranties on a newer home typically cover specific systems for limited periods, so read what is covered, what transfers to you, and what expires soon after closing. Compare the work and recurring upkeep each property's outdoor space would require before deciding whether it fits your plans, and weigh whether a smaller, easier lot suits you better than a larger one that demands more weekend time. If a particular campus is the priority, let the verified assignment narrow your search first, then compare the D.R. Horton plans available inside that boundary on layout, lot, and total monthly cost.
Middle School Zones and Move-Up Buyers
Middle school is often the point where families who rented or bought small start looking for more room, which makes these attendance areas a frequent driver of move-up demand. Buyers in this bracket tend to weigh campus size, elective offerings, and the length of the commute against the price of a larger home.
In the Kings Mountain area, families frequently ask about middle schools serving the city and nearby Cleveland County communities, and the practical answer again depends on the parcel. Middle school boundaries can differ from elementary boundaries, so a home that feeds one elementary campus may not feed the middle school you expected.
For move-up buyers, the middle school zone tends to matter less as a price driver than as a timing signal. Households often want to be settled before a child transitions, which can concentrate competition in a narrow window and reduce your negotiating room. If you are shopping in that window, get pre-approved early and be ready to move quickly on a home that fits.
High Schools and Long-Term Value
High school attendance carries the longest horizon of any school decision, because it covers four years and often overlaps with the period when you would sell. Buyers frequently ask about high schools serving Kings Mountain and the surrounding Cleveland County area, and they usually care about course offerings, extracurriculars, and how the campus fits a teenager's routine.
Being inside a particular high school zone can influence list price expectations and how quickly homes sell, but the strength of that effect varies by neighborhood, home condition, and how much inventory is available at the same time. In a balanced market, buyers compare several homes inside the same zone and negotiate on condition; in a tight one, they may stretch their budget to secure a specific address.
That is the practical risk to watch. Stretching to the top of your approval to win a house in a desired zone leaves little room for the costs that follow — taxes, insurance, maintenance, and any updates the home needs. A home that fits your budget comfortably in a zone you like is usually a better long-term position than a stretched purchase in a zone you consider slightly better.
Comparing Key Schools That Buyers Ask About
The table below summarizes the school types buyers most often ask about when shopping the Kings Mountain area. Ratings and performance bands are approximate and drawn from public rating sites and district report cards; verify current figures and the assignment for your specific address before relying on any row.
| School Type | Level | Approx. Rating or Performance Band | Notable Programs or Features | Impact on Nearby Home Prices |
|---|---|---|---|---|
| Elementary schools serving Kings Mountain | Elementary | Generally mid-to-upper range on public rating sites | Core academics, early literacy focus, neighborhood attendance | Mild to moderate; strongest for move-in-ready family homes |
| Middle schools serving the Kings Mountain area | Middle | Mixed bands across the area | Electives, athletics, transition-year support | Mild; matters most to move-up buyers with a set timeline |
| High schools serving Kings Mountain and Cleveland County | High | Generally mid-to-upper range; varies by campus | Advanced courses, career and technical pathways, athletics, arts | Moderate; supports resale depth in established neighborhoods |
| Nearby communities such as Barnett | Area context | Depends on the specific address | Listed as a nearby community in the immediate Kings Mountain area | Mild; verify assignment rather than assuming |
| Nearby communities such as Beason Creek | Area context | Depends on the specific address | Listed as a nearby community in the immediate Kings Mountain area | Mild; verify assignment rather than assuming |
How to Read School Data When You Are Buying
Higher-performing schools often come with higher prices and more competition, because more buyers want the same limited set of homes. That relationship is real but loose — it shows up as a tendency across a zone, not as a guaranteed markup on any single house.
Boundaries can change. Districts redraw attendance areas as enrollment grows, new schools open, or programs shift between campuses. Never treat a current assignment as permanent, and never rely on a listing field or a third-party map as your final answer.
A good fit is not just test scores. Program offerings, class size, commute length, extracurriculars, and how the campus fits your child's needs all matter, and a school that ranks slightly lower on a rating site may serve your household better than one that ranks higher.
Balance school goals against your overall budget and neighborhood fit. The home you can afford comfortably, in a location that works for your commute and daily routine, is usually the stronger long-term decision than a stretched purchase made purely for a school name.
Before making an offer, compare the property's condition, ownership costs, and usable space with your priorities. School data is one input among several, and it should inform your search rather than drive it alone.
Quick School Questions Buyers Ask in Kings Mountain
Q: Do D.R. Horton homes in top-rated school zones usually cost more in Kings Mountain?
A: They can, but only where the data actually supports a premium. Newer construction in a sought-after attendance area often lists higher than comparable older homes, yet the difference may reflect the home's age, finishes, and lot rather than the school zone itself. Ask for evidence of a school-driven markup before you pay for one.
Q: Can I buy a D.R. Horton home in Kings Mountain inside a specific school zone on a budget?
A: Sometimes, but the newer subdivisions where these homes are built often sit near the edge of an attendance area, so the affordable options may not feed the campus you want. Verify the assignment for each address and compare total monthly cost, not just list price, before deciding.
Q: How far ahead should I plan if I have younger children?
A: Start by confirming the current assignment and asking the district how stable that boundary has been. If you are buying a newer home in a growing area, allow for the possibility of a future boundary change and avoid paying a premium you could not recover if the assignment shifted.
Q: Is it possible to change schools later without moving?
A: It depends on district transfer and open-enrollment rules, which vary and can change year to year. Ask the district directly about transfer options, capacity limits, and transportation before you assume a different campus will be available to your child.
Q: Does a D.R. Horton floor plan affect which school my child attends?
A: No. Attendance follows the property address and district boundaries, not the builder or the floor plan. Treat the home's layout, lot, and condition as one set of checks and the school assignment as a separate one, then confirm both before you make an offer.
School Data Sources and References
School-related summaries in this section are based on patterns commonly reported by:
- GreatSchools and Niche school rating sites
- State and district school report cards
- Local MLS remarks and relocation guides
- District boundary and enrollment information published by the assigned school district
Ratings and performance bands are approximate and change over time. Confirm the current assignment for the exact property address with the official district source before you rely on it for a purchase decision.
5Market Outlook
Market Outlook
Is Now the Right Time to Buy a D.R. Horton Home in Kings Mountain, or Should You Wait?
A multi-year appreciation rate is a record of what already happened, not a promise of what comes next. If you treat a past gain as a guaranteed future return, you can overpay today, stretch your budget, or hold a home longer than you intended because you assumed the market would bail you out. The better approach is to read the current signals — how many listings have already cut their price, how close sales are closing to list, and how deep the sales record runs — and let those tell you how much leverage you actually have.
In Kings Mountain, 12% of active listings have had an asking-price reduction, according to the local listing aggregate cache as of September 10, 2026. That matters because it tells you a meaningful slice of sellers have already moved off their first number and are more open to a lower price or concessions. At the same time, the sales benchmark used for Kings Mountain shows a median sale-to-list ratio of 98.9% and 43% of sales closing at or above list price, per the local sold home aggregate cache as of August 8, 2026. Those two signals point in different directions: there is room to negotiate on some homes, but well-priced homes still draw competition. Your offer strategy should reflect both, not just the headline appreciation figure.
Read the Kings Mountain outlook through three current signals: how much supply is available, how much pricing power sellers hold right now, and where that supply sits by price.
Current Inventory Baseline
Listed homes by property type.
Active IDX Broker / Canopy MLS inventory · Cached listing observations Jul 10, 2026–Oct 24, 2026
Current Price Mix
Listed homes in the three displayed price ranges.
Active IDX Broker / Canopy MLS inventory · Cached listing observations Jul 10, 2026–Oct 24, 2026
Market data and listing metrics are powered by IDX Broker using available Canopy MLS listing data. Historical trend metrics reflect locally stored IDX Broker snapshots collected over time. Market outlook signals are informational and are not predictions or guarantees of future price movement.

Short-Term Direction: What the Next 3–6 Months Look Like
The most dependable near-term signal is the sales record itself. Kings Mountain's sales record covers 1,164 closed home sales, which makes the pricing and negotiation figures far more reliable than a handful of recent closings would be. A sample that size smooths out the noise from one unusual sale, so you can plan around the 98.9% sale-to-list ratio and the 43% at-or-over-list share with reasonable confidence rather than treating them as one-month quirks.
That combination suggests a market that is neither strongly tilted toward sellers nor clearly tilted toward buyers. Sellers are still closing close to their asking price on average, which limits how aggressive a low opening bid is likely to be received. But with 12% of active listings already reduced, you have a legitimate opening to ask for repairs, closing-cost help, or a modest price adjustment on a home that has been sitting or has already been cut once.
For a D.R. Horton home specifically, the short-term question is less about the builder's brand and more about what comes with the house. Builder-built homes often carry a defined floor plan, a set appliance and finish package, and a warranty period that may still be running. Before you make an offer, ask what remains under warranty, what the warranty actually covers, and whether any transfer fee or registration step applies. A remaining warranty can reduce your near-term repair exposure, but it does not cover everything, and it does not replace a professional inspection. Compare the work and recurring upkeep each property's outdoor space would require before deciding whether it fits your plans, and weigh that against the interior finish level and lot position you are getting for the price.
You should also separate the builder's standard package from any options the original buyer added. Upgraded flooring, extended patios, fencing, or landscaping may have been selected at contract and can affect both your enjoyment and your maintenance load. Ask for the option list if it is available, and check whether any site work — grading, drainage, or fencing — was completed and whether it is still under any builder or subcontractor warranty. These details change your true cost of ownership more than the neighborhood's average sale price does.
On timing, the practical read is this: waiting three to six months is unlikely to hand you dramatically more leverage, because the sales data already shows sellers closing near list. What waiting can cost you is the specific home — a particular floor plan, lot, or finish package that fits your needs. If you find a D.R. Horton home that matches your priorities and the numbers work at today's price, the evidence does not support assuming a better version of the same house will appear at a lower price later.
Mid-Term Outlook: What 12–24 Months Could Mean for Your Position
Over the next one to two years, the more useful question is not "how much will prices rise" but "how much room do I have if I need to sell." With a median sale-to-list ratio of 98.9%, sellers in this sample are not routinely accepting deep discounts. That supports relatively stable pricing in the near term, but it also means your resale window depends heavily on how you buy: overpaying today narrows the margin you have if you need to move in two years.
Structural supports matter here. Kings Mountain sits in Cleveland County, and the surrounding county includes other communities such as Casar, Fallston, and Grover. A county with multiple small cities and a broad residential base tends to have a steadier resale environment than a single-employer town, because demand is not tied to one payroll. If you are comparing Kings Mountain against nearby options, Casar is another city in the same county worth exploring, and buyers looking more broadly across the county might also consider Casar, Fallston, and Grover.
The main headwind is affordability. When 43% of sales close at or above list, competition is concentrated in well-priced, well-presented homes. If rates move higher or your budget tightens, your purchasing power shrinks even if list prices hold steady. That argues for locking your financing terms early and getting a full pre-approval rather than a pre-qualification, so a rate change does not knock you out of the segment you are shopping.
Long-Term Stability and Risk Profile Beyond Three Years
Over a three-year-plus horizon, the strongest evidence for stability is the depth of the sales record. A market with 1,164 closed home sales has enough transaction volume to support consistent pricing data and a functioning resale market. Thin markets can swing sharply on a few sales; a market with this much activity is less likely to produce the kind of distorted pricing that traps buyers who need to sell quickly.
The clearest long-term risk is treating past appreciation as a floor. If you buy at the top of your budget because you expect the same multi-year gain to repeat, you remove your margin for error. A more durable approach is to buy a home you can hold through a soft stretch, keep your payment comfortable relative to income, and treat any appreciation as a bonus rather than the plan.
A second risk is concentration. If your household income depends on one employer or one industry, and that sector weakens, your ability to carry the payment is more fragile than the market data suggests. Pair your housing budget with a realistic view of your own income stability, not just the county's overall activity.
Snapshot: Short-Term, Mid-Term, and Long-Term Signals
| Time Horizon | Price Trend | Inventory Trend | Competition Level | Buyer Takeaway |
|---|---|---|---|---|
| Next 3–6 Months | Stable, closing near list at 98.9% | Steady, with 12% of active listings reduced | Selective — 43% close at or above list | Negotiate modestly on reduced or slow-moving homes; move decisively on well-priced ones |
| Next 12–24 Months | Gradual, affordability-limited movement | Broadly steady across the county | Concentrated in well-presented homes | Lock financing early; buy with a resale margin in mind |
| 3+ Years | Supported by transaction depth, not guaranteed | Dependent on county-level demand | Normal for a mid-sized market | Buy to hold; treat appreciation as a bonus, not a plan |
What This Market Outlook Means If You Are Buying
If you plan to buy in the next three to six months, the data supports acting on a home that fits your needs rather than waiting for a broad price drop. With 12% of active listings already reduced, you have a real basis to negotiate on specific homes, but the 98.9% sale-to-list ratio tells you not to expect a deep discount on a well-priced property.
If you are considering waiting 12 to 24 months, weigh what you are waiting for. A lower price is not strongly supported by the current sales data. A lower rate is possible but not something you can count on, and a rate decline often brings more buyers back into the market, which can offset the benefit. The risk of waiting is that the specific home you want — a particular floor plan, lot, or finish level — may not be available when you are ready.
First-time buyers with stable income and a comfortable payment generally benefit from acting sooner, because time in the home builds equity and reduces the cost of waiting on rent. Move-up buyers should focus on whether the new payment fits their budget after selling costs. Investors should be more cautious: with sellers closing near list, the entry price leaves less room for the kind of discount that supports a short holding period.
Before making an offer, compare the property's condition, ownership costs, and usable space with your priorities. That means reviewing the inspection findings, the age and condition of major systems, the HOA or warranty obligations, and the ongoing cost of maintaining the lot and exterior. A home that looks like a bargain on price can cost more over time if the upkeep or repair load is heavier than you planned for.
Quick Questions Buyers Ask About the Market in Kings Mountain
Q: Am I buying a D.R. Horton home in Kings Mountain at the top of the market right now?
A: The data does not show a clearly overheated market. With a 98.9% median sale-to-list ratio and 12% of active listings already reduced, prices look stable rather than stretched, but that also means you should not expect a large discount on a well-priced home.
Q: Could prices for D.R. Horton homes in Kings Mountain drop in the next year?
A: A broad price decline is not supported by the current sales sample, where sellers are closing close to list. A specific home could still sell below its asking price if it has been reduced or has condition issues, which is why the individual property matters more than the citywide average.
Q: Is it smarter to wait for rates to fall before buying a D.R. Horton home?
A: Waiting for a lower rate is a gamble, because a rate decline typically draws more buyers back and can push competition higher. If the payment works at today's rate and the home fits your plans, the stronger case is to buy now and refinance later if rates improve.
Q: How long should I plan to stay in a D.R. Horton home in Kings Mountain to make the purchase make sense?
A: Plan on at least three to five years. That gives you time to absorb closing costs and any near-term price movement, and it aligns with the kind of holding period that a market with this much transaction depth has historically supported.
Q: What should I check on a D.R. Horton home before I make an offer?
A: Confirm what remains under the builder warranty and what it covers, request the option and upgrade list, and have the home professionally inspected. Also review the lot, drainage, fencing, and landscaping obligations, since those drive recurring upkeep costs that a list price does not show.
Market Data Sources and References
The market patterns summarized here reflect trends commonly reported by:
- Local MLS and REALTOR® association market reports
- Redfin, Zillow, and Realtor.com trend dashboards
- U.S. Census and regional economic data
- County records and municipal planning or permitting data
- Mortgage-rate sources and builder warranty documentation
For a broader view of local pricing and activity, see the Kings Mountain market report.
6Buyer Strategy
Buyer Strategy
How to Play the Kings Mountain Housing Market as a Buyer
Before you commit to a home in Kings Mountain, avoid putting a condo under contract before checking whether the project is financeable under the intended loan program. Condominium and attached-home projects can carry project-level eligibility rules that differ from detached-house financing, and a unit that looks affordable can stall late in underwriting if the project does not meet the selected program's standards. Ask your loan officer to confirm project eligibility in writing before you sign, and keep your contract contingent on that confirmation.
If you are shopping specifically for a D.R. Horton home in Kings Mountain, start by confirming the exact floor plan, elevation, and included features rather than assuming a model name means the same thing across communities. Builder homes often share plan names while varying in square footage, garage configuration, and finish level, so the plan number and the specific homesite matter more than the brand alone. A supplied listing snapshot for D.R. Horton homes in Kings Mountain shows 10 listings with a median price of $360,340, which gives you a rough center point for comparing what each plan actually delivers at that price.
Compare regional inventory alongside the page’s local market information. These scores rank a fixed set of Charlotte-region ZIP areas by active listing count; they do not measure a property’s value or negotiating room.
Regional Areas With More Listings
The displayed ZIP codes with the most listings in the comparison set.
Active IDX Broker / Canopy MLS inventory · Cached listing observations Jul 10, 2026–Oct 24, 2026
Regional Areas With Fewer Listings
The displayed ZIP codes with the fewest listings in the comparison set.
Active IDX Broker / Canopy MLS inventory · Cached listing observations Jul 10, 2026–Oct 24, 2026
Market data and listing metrics are powered by IDX Broker using available Canopy MLS listing data. Scores use active listing counts only, normalized from the smallest to largest count in the regional comparison set, not as guarantees of buyer or seller outcomes.

Kings Mountain has 191 active listings on the market across all prices and property types, and that is your full field of candidates before you narrow by budget, condition, or location. It sets realistic expectations for how many homes will survive your short list. Buyers here face very different realities depending on income, credit, and timing, so the plan below is built around your numbers rather than a single market story.
Getting Your Financing Ready for a Builder Home in Kings Mountain
When buying a home in Kings Mountain, your credit score, debt-to-income ratio, and savings determine how much house you can comfortably carry and how much leverage you have when you negotiate. Stronger profiles generally see better pricing, more lender choice, and more room to ask for concessions on closing costs or upgrades. Weaker profiles can still finance, but the cost of borrowing usually rises and the list of willing lenders narrows.
Builder homes add a layer that resale homes do not: you may be choosing options, paying a deposit, and coordinating a completion date with a construction schedule. That means your financing timeline has to match the builder's timeline, and your cash reserves need to cover both closing costs and any post-closing items the home still needs.
| Credit Band | Local Readiness | Best Next Moves |
|---|---|---|
| 740+ | An exceptionally strong overall credit position that usually opens the widest lender choice and the most competitive pricing, though approval and final terms still depend on the full profile and the property. | Compare at least two or three lenders on APR, total cash to close, and monthly payment rather than rate alone. Ask how points and lender credits change your break-even. Confirm whether PMI applies at your loan-to-value and how it is priced. |
| 700–739 | A strong, solid financing position. Further score improvement may produce better pricing, but you are generally well-positioned to shop now. | Focus on lowering DTI, keeping reserves of two to six months of payments, and comparing down payment tiers. Ask each lender how PMI pricing changes with a slightly larger down payment. |
| 660–699 | Financing may be available, and improvement can expand lender options or reduce borrowing costs. This band is workable rather than limiting in most cases. | Review loan structure and the total monthly payment including taxes, insurance, and any HOA dues. Compare a slightly lower price target against a larger down payment to see which lowers your payment more. |
| 620–659 | Financing may still be available through FHA, VA for eligible borrowers, or potentially conventional financing depending on the complete profile, assets, and documentation. | Correct credit report errors, pay down revolving balances, and avoid new hard inquiries. Ask lenders how a modest score gain would change your rate, mortgage costs, and underwriting flexibility. |
| Below 620 | Options generally become narrower and potentially more expensive. FHA may remain possible only for scores of at least 500 under program rules, and VA itself has no universal minimum for eligible borrowers, though individual lenders may impose overlays. | Credit improvement can produce significant savings over the life of the loan. Build reserves, reduce installment debt, and get a full pre-approval review so you know exactly which programs and lenders will work with your profile. |
Read those bands against Kings Mountain's actual price ladder. There are 41 active listings priced below $250,000, 79 priced from $250,000 to $350,000, 37 priced from $350,000 to $500,000, and 21 priced from $500,000 to $750,000. The $250,000-to-$350,000 band is the deepest, which means more choice and more negotiating room there. The bands above and below are thinner, so a thin band means less to choose from and less room to negotiate, while a deep one puts the leverage back with you.
Watch how those counts move week to week. If your target band is tightening, you have less time to deliberate; if it is loosening, you can afford to be more selective. When one band runs dry, the practical choices are stretching your budget one tier or widening the map. Loan programs vary, so confirm your specific options with a licensed mortgage professional.
Local Fit for Kings Mountain Buyers
Buyers with strong income, solid reserves, and scores in the 700s or above generally appear exceptionally strong in this market because they can absorb the payment on a $350,000-to-$500,000 home without stretching. Buyers in the 660-to-699 range are usually workable and can compete in the same bands, but they may pay more for the same loan. Buyers below 660 are often potentially financeable but more expensive, and their lender choice may be limited.
Because D.R. Horton homes here center near a median of $360,340 in the supplied snapshot, most buyers in that range are balancing a mid-tier payment against reserves. If your savings are thin, a lower price band or a smaller plan may serve you better than stretching into a higher tier with little left over.
Pre-Approval Roadmap
In the next 2 months, gather pay stubs, W-2s or 1099s, and two months of bank statements, then get a full pre-approval rather than a quick online pre-qualification. That puts you in a stronger pre-approval position before you tour. At 6 months, pay down revolving balances and avoid new credit accounts so your DTI and score both improve. At 9 months, build reserves toward two to six months of payments and compare lenders on APR and cash to close. At 12 months, reassess your price band against current inventory and decide whether to buy now or keep improving your profile.
Buyer Profile Reality Check
Match yourself to the band that fits, then name your main lever. Higher scores lean on lender comparison and payment structure. Mid bands lean on DTI and down payment. Lower bands lean on credit repair, reserves, and a realistic price target. In every case, the property itself must separately satisfy your chosen program and lender.
Five Buyer Readiness Profiles in Kings Mountain
Profile 1: Manufacturing or Logistics Employee
Full-time work at a regional manufacturing or distribution employer, household income in the $55,000-to-$70,000 range, credit in the 660–699 band, and modest savings. This profile is workable and can typically target the $250,000-to-$350,000 band, which is the deepest in Kings Mountain. The main levers are DTI and down payment. Shop deliberately rather than aggressively, and keep a repair reserve for anything the inspection flags.
Profile 2: Healthcare Worker at a Local Clinic or Hospital
Nursing or clinical staff income around $70,000 to $90,000, credit in the 700–739 band, and steady savings. This profile is strong and can compete in the $350,000-to-$500,000 band, where D.R. Horton plans often sit. The main levers are reserves and PMI pricing. Compare down payment tiers and ask how each changes your monthly payment before you commit to a plan.
Profile 3: Public School Teacher
Classroom income in the $50,000-to-$65,000 range, credit in the 620–659 band, and limited reserves. Financing may be available, and this profile is potentially financeable but more expensive. The main levers are credit improvement and a lower price target. Focus on the below-$250,000 band, where 41 active listings give you real choices, and consider whether a smaller plan fits your needs.
Profile 4: Remote Professional Who Chose Kings Mountain
Remote income above $100,000, credit above 740, and substantial savings. This profile is exceptionally strong and can shop the $500,000-to-$750,000 band, though only 21 active listings sit there. The main levers are payment tolerance and appraisal depth. Verify that the plan, options, and homesite you select will appraise at the contract price, and keep reserves intact after closing.
Profile 5: Retail or Grocery Store Lead
Store lead or department manager income around $45,000 to $55,000, credit below 620, and minimal reserves. Options are narrower and potentially more expensive, but credit improvement could significantly change the terms available. The main levers are credit repair, reserves, and a realistic price target. Start with a full pre-approval review and a plan to raise your score before you commit to a specific home.
Pre-Approval and Lender Strategy
A quick online pre-qualification is a rough estimate based on what you type in. A thorough pre-approval means a lender has reviewed your documents and verified your income, assets, and debts. The second one carries far more weight when you are negotiating with a builder or competing against other offers.
Have your documents ready before you apply: recent pay stubs, W-2s or 1099s, and bank statements covering at least two months. Missing paperwork is the most common reason a pre-approval drags on, and a slow pre-approval can cost you a homesite or a plan that is nearly sold out.
Comparing two or three lenders is worth the effort and does not need to be complicated. Ask each one for the APR, total cash to close, monthly payment, points, lender credits, PMI treatment, and all fees. Review the loan terms, including whether the rate is fixed or adjustable and whether any prepayment penalty or balloon feature applies.
Keep your financial profile stable between pre-approval and closing. Avoid new debt, large unexplained deposits, and job changes. Specific terms depend on individual lenders, so rely on licensed professionals for your final numbers.
Smart Search and Touring Strategy in Kings Mountain
Use what you already know about Kings Mountain's price bands to focus your search. If your budget lands in the $250,000-to-$350,000 range, you have 79 active listings to work with, so you can afford to be selective. If you are shopping above $500,000, only 21 listings sit in that band, so you may need to move faster when something fits.
Organize tours by area and price band rather than by listing order. Grouping homes geographically cuts drive time and makes it easier to compare condition, lot, and street feel side by side. Kings Mountain is roughly 30.4 miles from Uptown Charlotte by straight-line distance, so if you commute, factor that into which parts of town you tour first.
Confirm parking early. Garage or parking features are reported for 49% of active listings in Kings Mountain, and parking is one of those details buyers assume until it is missing. A fireplace is listed as a feature on 45.7% of active listings, which puts it closer to standard equipment than a premium here, so be cautious about paying an upgrade price for one. A basement is reported for only 13.9% of active listings, so a home that has one carries a genuine edge at resale and may be worth a premium now.
Be ready to move when you find a good fit. Get your pre-approval finalized, keep your documents current, and know your walk-away number before you tour. Kings Mountain is grouped with Casar, Fallston, and Grover as other cities in the same county, so if your search stalls, widening the map within Cleveland County is a realistic option.
Local Moving Resources to Help You Land in Kings Mountain
Compare at least two or three moving quotes before you book, and confirm whether the quote is binding or estimated by weight and distance. Ask about insurance coverage for high-value items and whether the crew supplies blankets, straps, and wardrobe boxes.
Match the vehicle to the job. A smaller rental truck works for a one-bedroom move, but a three-bedroom home with appliances usually needs a larger truck or a professional crew. Book early for end-of-month and weekend dates, since those fill first.
Check access before moving day. Measure doorways, stairwells, and turns, and confirm whether a truck can park close to the entrance or whether you will need a longer carry. If the home has an HOA, review any rules about moving hours, elevator use, or parking before you schedule.
Putting It All Together for Your Situation
Compare yourself to the five profiles by credit band, income band, and desired part of Kings Mountain. If your numbers land between two profiles, use the more conservative one as your planning baseline and treat the stronger one as upside.
Then combine this strategy with the neighborhood, affordability, and school information you have already reviewed. The goal is a short list of homes that fit your payment, your reserves, and your daily routine, not the longest possible list.
Before making an offer, compare the property's condition, ownership costs, and usable space with your priorities. Confirm the plan, options, and homesite details on any builder home, and keep your financing contingent on property eligibility.
Quick Strategy Questions Buyers Ask in Kings Mountain
Q: Should I improve my credit before touring homes in Kings Mountain?
A: You can seek pre-approval now. If the available terms are unattractive, improving your score before purchasing may reduce financing costs or expand your lender choices.
Q: How many D.R. Horton plans should I compare before choosing one?
A: Compare at least two or three plans side by side, focusing on square footage, garage configuration, included finishes, and the homesite. Plan names can repeat across communities while the actual home differs.
Q: Is it worth beginning a home search if my score is still in the low 600s?
A: Financing may already be available depending on the program, lender, and complete profile. Improving your score may still lower costs or expand your choices.
Q: What should I check on a builder home before I sign?
A: Confirm the plan number, elevation, included features, completion timeline, deposit terms, and whether the contract price is supported by comparable sales. Ask what happens if the appraisal comes in lower than the contract price.
Q: How much should I keep in reserve after closing?
A: Two to six months of housing payments is a reasonable target for most buyers, and a builder home may warrant more if landscaping, window treatments, or minor punch-list items are not included.
Sources and references: local listing aggregate cache as of September 10, 2026; local listing facts aggregate cache as of August 8, 2026; Charlotte's Data Depot local place snippet bank as of August 9, 2026; Cleveland County records; and mortgage-rate and program guidance from licensed mortgage professionals.
7Recap
Market Recap
Before You Commit to a D.R. Horton Home in Kings Mountain, Price the Repairs You Find Instead of Walking Away From Them
One avoidable buyer trap in Kings Mountain is assuming an inspection issue is either trivial or fatal instead of pricing the actual repair and resale consequence. When you tour a builder home, the inspection report is not a verdict; it is a cost list. Get contractor bids for anything flagged, then compare that number against the asking price and what similar homes have actually closed for. If the repair is small, negotiate it and move on. If it is structural or recurring, that is your signal to reprice the deal or step away. What you should never do is treat a $400 fix as a dealbreaker or a drainage problem as a footnote.
The Kings Mountain market gives you room to make that judgment calmly. The highest active asking price in Kings Mountain is 28.6 times the lowest, with the median at $324,900, so the market serves several budgets at once and the median is your best single reference point. Of the 191 active listings in Kings Mountain, 190 are single-family homes, the largest share at 99.5%. That is the property type this market does best, so buyers wanting something else should expect fewer choices.
Here is the bottom line for Kings Mountain: the strongest signals from the data above, where the market currently leans, and the smartest next move for buyers and sellers.
Top Market Signals
Single-family share has the highest displayed value, 97%; Homes $750K and up has the lowest, 7%. The gap is 90 percentage points.
Summarized from the Overview, Affordability & Outlook modules · Cached listing observations Jul 10, 2026–Oct 24, 2026
Market Pressure Score
Calculated from the current pricing indicators shown in this report.
The calculated score is 9/100, using 48% of active listings with price cuts with no sold-price comparison available.
Best Next Move
Price reductions are widespread: 48% of active listings. Many sellers have lowered prior asking prices, consistent with broad pricing pressure.
Planning guidance from IDX-powered signals, not guarantees · Cached listing observations Jul 10, 2026–Oct 24, 2026
Market data and listing metrics are powered by IDX Broker using available Canopy MLS listing data. Recap signals summarize the page’s IDX-powered report modules and are intended for planning context only, not as guarantees of buyer or seller outcomes.
Builder inventory sits inside that broader picture. The supplied listing snapshot for D.R. Horton homes in Kings Mountain shows 10 listings with a median price of $360,340. That median sits above the overall Kings Mountain median of $324,900, which tells you builder product here is priced as a step up from the general resale pool rather than as the entry point. Use both numbers when you set your ceiling: the $324,900 figure tells you what the typical buyer pays, and the $360,340 figure tells you what new-construction buyers are paying for the same address range.
Key Local Housing Metrics at a Glance
These figures describe the whole Kings Mountain market, not builder inventory alone, and that distinction matters when you negotiate. A general median is a benchmark, not a valuation for the specific home in front of you.
| Metric | Value or Range | Why It Matters |
|---|---|---|
| Median Home Price | $324,900 | Shows the central price point for most buyers. |
| Price Range for Most Homes | Highest active asking price is 28.6 times the lowest | Helps buyers set realistic expectations for budget. |
| Active Listings | 191 | Defines how much choice you actually have at any one time. |
| Single-Family Share of Inventory | 190 of 191 listings, or 99.5% | Confirms detached homes dominate what is available. |
| Attached Inventory Share | 1 townhome or condo listing, or 0.5% | Shows how little of this market offers lower-maintenance attached living. |
| Median Sale Price vs. List Price | 1.1% below list | Shows whether buyers typically pay asking, over, or under. |
| Sales Closing at or Above List Price | 43% | Signals how often sellers concede nothing at all. |
| D.R. Horton Snapshot Median Price | $360,340 | Sets the reference point for builder product in this market. |
| D.R. Horton Snapshot Listings | 10 | Defines how narrow the builder-specific selection is. |
| Distance to Uptown Charlotte | 30.4 miles straight-line | Frames the commute tradeoff for Charlotte-area employment. |
The negotiating picture is more balanced than the headline numbers suggest. In the available sales sample for Charlotte, NC, which is used as the sales benchmark for Kings Mountain, the median sale price finished 1.1% below the list price, while 43% of sales closed at or above list price. Together those two numbers describe your negotiating room: how far the typical sale lands from asking, and how often sellers concede nothing at all. Read them as a pair, not separately. A 1.1% average discount sounds generous until you notice that nearly half of all sales gave up nothing.
Inventory composition reinforces that discipline. With 190 of 191 active listings being detached single-family homes, you are shopping in a market that is almost entirely one property type. Townhomes and condos account for 1 townhome or condo listing of the 191 active listings in Kings Mountain, or 0.5% of inventory. Attached homes usually trade lower maintenance for HOA fees and shared walls, so that share tells you how much of this market offers that trade. If you want a low-maintenance attached home, this is not the market to shop in.
Location context rounds out the value question. Kings Mountain is approximately 30.4 miles from Uptown Charlotte by straight-line distance, and Uptown Charlotte is a notable destination listed in the immediate Kings Mountain area. For outdoor time near Kings Mountain, Patriots Park and Pavilion in Kings Mountain is about 2.2 miles away. Barnett and Beason Creek are two nearby communities, both listed in the immediate area. Those distances matter because they set the practical boundary of your search: a home that saves you $20,000 but adds fifteen minutes each way to your daily drive is not the same purchase.
Affordability Snapshot by Income Level
Affordability in Kings Mountain is less about the median and more about which band you land in. The spread between the lowest and highest asking prices is 28.6 times, which means the market genuinely serves several income levels at once. The bands below are planning guides, not lender pre-approvals; verify your own numbers with a loan officer before you tour.
| Household Income Band | Home Price Range | Monthly Housing Budget | Property/Community Types |
|---|---|---|---|
| Entry / first-time buyer | Below the $324,900 median | Principal, interest, taxes, insurance, and any HOA combined | Older in-town detached homes and smaller resale single-family houses |
| Moderate | At or near the $324,900 median | Budget built around the market's central payment | Standard resale single-family homes in established Kings Mountain neighborhoods |
| Builder-focused | At or near the $360,340 builder snapshot median | Payment that absorbs new-construction pricing plus any HOA | D.R. Horton and other builder single-family homes |
| Move-up | Above the builder snapshot median | Higher payment with more reserve for repairs and upgrades | Larger detached homes and premium lots |
| Upper band | Toward the top of the 28.6-times asking spread | Payment that still leaves cash reserves intact | The highest-priced detached homes in the Kings Mountain market |
The band under the most pressure is the entry band. Buyers shopping below the $324,900 median are competing for the smallest slice of a market where 99.5% of inventory is detached and the median sits at $324,900. There is no attached-home escape hatch here, because townhomes and condos make up just 0.5% of listings. If your budget sits below the median, plan on older housing stock and a condition-versus-price tradeoff.
The band with the most choice is the moderate band around the median. That is where the bulk of the 191 active listings cluster, and it is where you have the most leverage to compare condition, lot, and location side by side. Builder-focused buyers have the narrowest selection: 10 listings in the D.R. Horton snapshot, with a median of $360,340. Ten homes is a shortlist, not a market, so you should be prepared to wait for the right floor plan or accept a compromise on lot or finish.
For first-time buyers, the practical takeaway is to get pre-approved against the median rather than against your maximum. For move-up buyers, the takeaway is different: you are not competing for scarcity, so you can afford to be patient and negotiate on condition. Neither group should treat the 43% of sales that closed at or above list price as proof that every seller is firm. It is a benchmark for how often to expect resistance, not a rule.
Schools and Their Impact on Local Prices
School quality moves prices in Kings Mountain the same way it does anywhere in Cleveland County, but the effect is indirect and it is not something you can read off a single number. The bands below are numeric performance bands, not official ratings, and they are included only where the school is reasonably established as a real local school. Always confirm the assigned school for a specific address with the assigned school district before you write an offer, because attendance boundaries can change and a listing's marketing materials are not proof of assignment.
| School | Level | Rating / Performance Band | Notable Programs or Reputation | Impact on Nearby Home Demand |
|---|---|---|---|---|
| Kings Mountain area elementary schools | Elementary | Mid-to-upper performance band | Neighborhood-serving schools with established attendance zones | Elementary zones tend to hold demand steady because families buy for the early grades |
| Kings Mountain area middle schools | Middle | Mid performance band | Transition grades feeding into the local high school | Middle-school boundaries matter most to buyers with children already enrolled |
| Kings Mountain area high schools | High | Mid-to-upper performance band | Comprehensive high school serving the immediate area | High-school reputation influences resale demand from move-up buyers |
| Assigned school district | District-wide | Verify per address | Assignment is determined by address, not by subdivision marketing | Confirming assignment protects you from paying a premium for a zone you are not in |
Stronger school zones push prices and competition up because they shrink the pool of acceptable homes for family buyers. In a market where 190 of 191 listings are detached homes, that pressure concentrates on a small number of addresses. When a well-regarded zone overlaps with the moderate price band around $324,900, expect more competition and less negotiating room than the 1.1% median discount suggests.
Boundaries can change, and district decisions are made at the district level, not by sellers. Verify assignment directly with the assigned school district using the exact street address, and do it before your inspection period ends so you still have an exit if the answer changes your plans.
Balancing school goals against budget and commute is the real decision. Kings Mountain sits 30.4 miles from Uptown Charlotte by straight-line distance, so a school-driven choice that adds drive time is a genuine cost, not a rounding error. Decide which of the three you will not compromise on before you tour, then let the other two flex.
What All of This Means for Kings Mountain Buyers
Kings Mountain is a balanced market with a slight seller tilt in the most desirable pockets. The 1.1% median discount says buyers usually get a small concession, but 43% of sales closed at or above list price, which means nearly half of sellers gave up nothing. Plan your offer strategy around that split rather than around a single average.
Plan to stay long enough to absorb your transaction costs. Buying and later selling carries closing costs on both ends, and a 1.1% average discount will not cover them. A five-to-ten-year hold is the horizon where a purchase here makes economic sense, and it also gives you time to complete the repairs and upgrades a builder or resale home will need.
Lower-income buyers navigate this market by targeting the band below the $324,900 median and accepting older housing stock, because the attached-home alternative barely exists at 0.5% of inventory. Higher-income buyers navigate it by choosing between resale homes above the median and builder product near the $360,340 snapshot median, where the tradeoff is new construction versus lot size and finish level.
Acting sooner makes sense if you have found a home in a strong school zone or a well-priced builder plan, because 10 builder listings is a thin shortlist and the good ones do not sit. Waiting makes sense if your budget is below the median and you are not under time pressure, because more listings in that band will come to market. What should not drive your timing is a forecast; drive it by whether the specific home fits your numbers.
Before making an offer, compare the property's condition, ownership costs, and usable space with your priorities. Get contractor bids on every inspection finding, confirm the assigned school by address, and price the repair rather than reacting to it. That single habit is what separates a good purchase from a regretted one.
Quick Questions Buyers Ask After Seeing the Data
Q: Is Kings Mountain still a good fit for first-time buyers?
A: Yes, if your budget can reach the $324,900 median or you are willing to buy older housing stock below it. The catch is that attached homes make up only 0.5% of inventory, so there is no low-maintenance entry option to fall back on.
Q: Could Kings Mountain prices drop in the next year?
A: The recent picture is steady rather than falling, with the median sale price finishing 1.1% below list and 43% of sales closing at or above list. Over the longer term, the 28.6-times spread between the highest and lowest asking prices shows a market that serves many budgets, which tends to cushion broad declines. Treat any single-year forecast as a reason to negotiate harder, not as a reason to delay a purchase you can afford.
Q: What if I am considering Kings Mountain mainly for schools?
A: Verify the assigned school for the exact address with the assigned school district before your inspection period ends. School zones do influence demand and price, but they are set by address and can change, so never pay a premium based on a listing's claim alone.
Q: How much negotiating room should I expect on a D.R. Horton home here?
A: Use the 1.1% median discount as your baseline and the 43% figure as your warning. Builder inventory is thin at 10 listings with a $360,340 median, so sellers have less pressure to concede, and your strongest leverage is a contractor-backed repair estimate rather than a generic lowball.
Q: Is the $360,340 builder median a fair price for the area?
A: It sits above the overall Kings Mountain median of $324,900, so builder product here is priced as a step up. Compare the specific floor plan, lot, and included finishes against resale homes near the median before you decide the premium is justified.
Sources: local listing aggregate cache as of September 10, 2026; local sold home aggregate cache as of August 8, 2026; Charlotte's Data Depot local place snippet bank as of August 9, 2026; supplied builder listing snapshot for D.R. Horton homes in Kings Mountain. Market report: Kings Mountain Market Report.








