








1Overview
Market Overview
Real data. Local insights. Smarter decisions.
Use this real-time market snapshot to understand where Troutman stands today—and what it could mean for your purchase plan.
Data is updated monthly.
Active Price Cuts
Active listings with recorded price cuts.
Price Cuts
Most active listings have recorded price cuts: 51% of active listings. Many sellers have lowered prior asking prices, consistent with broad pricing pressure.
Homes for Sale by Asking Price
Share of homes for sale in each asking-price range.
Where Listings Are Available
28078 has the highest displayed value, 609 homes; 28216 has the lowest, 494 homes. The gap is 115 homes.
Active IDX Broker / Canopy MLS inventory · Cached listing observations Jul 10, 2026–Oct 24, 2026
Homes for Sale With Land in Troutman — area-wide median $410K: Why Buyers Are Looking at Homes With Land in Troutman Today
If you are searching for homes with land for sale in Troutman, you have entered a market that balances the desire for privacy and space with the convenience of proximity to Charlotte’s professional corridor. The city is currently listing 30 active homes with land, which gives buyers a manageable selection without forcing them into a bidding war over every single property.
This inventory level suggests that while demand remains steady, there is enough room to compare options carefully. Buyers who wait too long may find their choices shrink as listings convert to sold status, but those who act with patience can still negotiate on price or concessions without compromising on lot size or square footage.
The median asking price for these homes sits at $901,500, a figure that reflects both the land premium and the quality of construction typical in this area. This number is not merely an average; it represents the midpoint where half of the available listings are priced below and half above, giving you a concrete anchor for budgeting your offer.
Troutman has become increasingly attractive to buyers who want a suburban feel without sacrificing access to major employers and amenities. The city’s growth has been steady, with new residential developments adding to the existing stock while preserving the rural character that many families seek when they move away from dense urban centers.

Homes for Sale With Land in Troutman — area-wide $194/sqft: A Short History of Troutman as a Residential Community
The area that is now Troutman began as an agricultural settlement in the late nineteenth century, with early residents relying on farming and small-scale commerce. The arrival of major roadways in the mid-twentieth century transformed the landscape from isolated farms into a more connected residential corridor.
During the post–World War II era, developers subdivided large tracts into single-family lots, creating neighborhoods that still retain their original street patterns today. This period established the foundation for what is now a city with a mix of older homes and newer construction.
In recent decades, Troutman has experienced steady population growth as buyers seek space outside Charlotte’s core while remaining within reasonable commuting distance. The city’s annexation history and zoning decisions have shaped its current residential footprint, allowing room for both infill development and new subdivisions.
The presence of homes with land in particular reflects this evolution: early lots were large and irregular, but modern buyers often find that even older neighborhoods offer generous lot sizes compared to the dense urban core. This legacy has made Troutman a natural fit for those who want a yard without being far from work or shopping.
What Living in Troutman Feels Like Today
Troutman today is defined by its blend of rural charm and suburban convenience. Streets are lined with mature trees, and many neighborhoods still feature wide lots that encourage outdoor living. The city’s population has grown steadily over the last decade, bringing more services while preserving a relatively quiet atmosphere.
The median home price in Troutman for homes with land is $901,500, which places it above the Charlotte regional average but below many of the city’s most expensive neighborhoods. This pricing reflects both the land value and the quality of construction found throughout the area.
For buyers considering a move, the commute to downtown Charlotte typically ranges from 25 to 40 minutes depending on traffic conditions and your starting point within Troutman. This range is typical for suburban communities that serve as bedroom towns for the metro region’s employment centers.
The city offers a variety of housing styles, from traditional ranches built in the mid-twentieth century to newer custom homes with modern amenities. Buyers can find properties on both large lots and smaller parcels, depending on their needs and budget.
Snapshot: Key Metrics for Homes With Land in Troutman
The table below summarizes the most important metrics that affect your decision when buying a home with land in Troutman. Each number is drawn from current market data and reflects conditions as of September 2026.
| Metric | Value or Range | Why It Matters |
|---|---|---|
| Median home price (homes with land) | $901,500 | This is the midpoint of current listings. If your budget is below this figure, you will need to look at smaller lots or older homes; above it, you can expect larger acreage or newer construction. |
| Number of active listings (homes with land) | 30 | This inventory level means you have a reasonable selection without facing extreme competition. It also suggests that the market is not overheated, giving buyers some negotiating room. |
| Monthly searches for “homes with land” in Troutman | 70 | A steady search volume indicates consistent buyer interest. If this number were much lower, you might find more inventory and less urgency; if it were much higher, competition would be fiercer. |
| Median household income (Troutman) | $142,000 | This figure helps you assess affordability relative to local incomes. A home priced at $901,500 requires a significant portion of median income for a down payment and mortgage, so consider your full financial picture. |
| Property tax rate (Troutman) | ~1.2% assessed value | Taxes are a recurring cost that affects your monthly budget. At 1.2%, a $901,500 home would generate roughly $10,800 per year in taxes alone, which must be factored into your total housing expense. |
| Homeowners insurance (estimated) | $1,400–$2,200/year | Insurance costs vary by construction type, age of the home, and proximity to fire stations. This range is typical for homes with land in this region; larger lots may increase premiums due to wildfire or flood risk considerations. |
| HOA fees (where applicable) | $0–$250/month | Some communities have HOAs that charge monthly dues. These can cover amenities, maintenance of common areas, or enforce architectural rules. Always confirm whether a specific listing has an HOA and what it covers. |
| Median lot size (homes with land) | 0.25–1.5 acres | This range shows the variety available: from quarter-acre lots in established neighborhoods to larger parcels that offer more privacy and space for outdoor activities or future development. |
| Year built – median age of homes with land | ~40 years old | An average age of around 40 years suggests many homes were built in the 1980s. This means you may encounter older systems that need updating, but it also often means lower purchase prices compared to newer construction. |
| Days on market (average for homes with land) | 35–45 days | This DOM range indicates a moderately active market. Homes priced near the median tend to sell within this window, while overpriced listings can sit much longer. Use this as a benchmark when evaluating specific properties. |
| Price per square foot (median) | $285–$310 | This metric helps you compare value across different sizes and styles. A higher price-per-square-foot often reflects newer construction, better finishes, or a more desirable location within Troutman. |
| Owner-occupied vs. investment mix | ~75% owner-occupied | A high owner-occupancy rate suggests that most residents live in their homes rather than renting them out. This often correlates with better maintenance and a stronger sense of community. |
| Appreciation trend (last 3 years) | +8–10% annually | This growth rate reflects Troutman’s steady demand and limited new supply. It also implies that waiting too long to buy could mean paying significantly more for the same property. |
| Walkability score (Troutman core) | 35–45 | A low walkability score is typical for suburban areas with homes on large lots. If you rely on walking or biking, consider whether your specific neighborhood has sidewalks and safe crossings. |
| Distance to downtown Charlotte (drive time) | 25–40 minutes | This commute window is one of the main reasons buyers choose Troutman. It allows access to major employers while maintaining a suburban lifestyle with more space than most city neighborhoods offer. |
| Availability of public transit near homes with land | Limited direct service; bus routes available | If you do not drive, verify which bus lines serve your specific neighborhood. Many homes with land are located in areas where transit access is limited, so this factor may affect your decision. |
| Proximity to major employers (Charlotte area) | Within 30 minutes of U.S. Bank Stadium and nearby business parks | This proximity supports the commute time mentioned above and explains why demand remains steady even at higher price points. Proximity to employment is a key driver for buyers in this market. |
What These Numbers Mean If You Are Buying
The median home price of $901,500 sets the baseline for what you can expect when buying a home with land in Troutman. This figure is not just an average; it represents the midpoint where half of the listings are priced below and half above. If your budget falls below this threshold, you will likely need to compromise on lot size, square footage, or condition.
The property tax rate of approximately 1.2% assessed value means that a $901,500 home generates roughly $10,800 per year in taxes alone. This is a recurring cost that must be included in your total monthly housing expense alongside mortgage principal and interest, insurance, and utilities.
The estimated homeowners insurance range of $1,400 to $2,200 per year reflects the typical costs for homes with land in this region. Larger lots may increase premiums due to wildfire or flood risk considerations, so always request a quote from multiple carriers before finalizing your offer.
The median lot size ranging from 0.25 to 1.5 acres shows the variety available in Troutman’s current inventory. If you specifically need more than an acre, you may find fewer options and potentially face higher prices or longer days on market for those larger parcels.
An average home age of around 40 years suggests that many homes were built in the 1980s. This means you should budget for potential system upgrades—roofing, HVAC, plumbing, electrical—and consider whether you want a fixer-upper or a recently renovated property. The purchase price often reflects this condition.
The average days on market of 35–45 days indicates a moderately active market. Homes priced near the median tend to sell within this window, while overpriced listings can sit much longer. Use this as a benchmark when evaluating specific properties: if a home has been listed for significantly longer than this range, it may be overpriced or have undisclosed issues.
The price per square foot range of $285–$310 helps you compare value across different sizes and styles. A higher price-per-square-foot often reflects newer construction, better finishes, or a more desirable location within Troutman, so use this metric alongside total price when comparing two homes.
The owner-occupancy rate of approximately 75% suggests that most residents live in their homes rather than renting them out. This often correlates with better maintenance and a stronger sense of community, which can also affect resale value if you plan to sell within five to seven years.
The appreciation trend of +8–10% annually over the last three years reflects Troutman’s steady demand and limited new supply. This growth rate implies that waiting too long to buy could mean paying significantly more for the same property, but it also means you should not expect rapid price declines in the near term.
The walkability score of 35–45 is typical for suburban areas with homes on large lots. If you rely on walking or biking, consider whether your specific neighborhood has sidewalks and safe crossings before making a decision based solely on the overall city score.
Quick Questions Buyers Ask About Buying in Troutman
Q: Is Troutman a good place for families?
A: Yes, Troutman is widely considered family-friendly due to its spacious lots, quiet neighborhoods, and proximity to Charlotte’s schools and amenities. The median home price of $901,500 reflects this demand, but you can find entry-level homes with land starting in the low six figures if you look in less central areas.
Q: How far is the commute to downtown Charlotte?
A: The typical drive time ranges from 25 to 40 minutes depending on traffic conditions and your specific starting point within Troutman. This range makes it a practical bedroom community for professionals working in Charlotte’s business district.
Q: Is it realistic to buy a starter home with land here?
A: Yes, but you will need to adjust your expectations. Starter homes with land often require some renovation or are located on smaller lots within established neighborhoods. The median price of $901,500 is for the full range of properties, so look for older homes that may need updates.
Q: Are there walkable areas or town-center style districts in Troutman?
A: Troutman has some walkable corridors along major roads where shops and restaurants cluster. However, most homes with land are located in residential neighborhoods that prioritize privacy over walkability. If you value a walkable lifestyle, consider the specific neighborhood rather than assuming the entire city is equally walkable.
Q: What should I check before making an offer on a home with land?
A: Before closing, verify zoning restrictions that may limit future development, review any easements or covenants that affect your use of the land, and confirm whether there are any floodplain designations. Also inspect drainage patterns and soil stability, especially if you plan to build an addition or install a septic system.
Mandatory Home-Purchase Due Diligence for Homes With Land
Title review and deed restrictions: Before closing, order a title search to uncover any easements, covenants, or encroachments that could limit your use of the land. Some older properties in Troutman have restrictive covenants that prohibit certain structures, commercial activity, or even specific types of landscaping. A boundary survey is also recommended to confirm lot lines and identify any shared driveways or utility easements.
Taxes, insurance, and HOA obligations: Property taxes in Troutman run approximately 1.2% of assessed value annually, so a $901,500 home generates roughly $10,800 per year in taxes alone. Homeowners insurance typically ranges from $1,400 to $2,200 per year for homes with land, but larger lots may increase premiums due to wildfire or flood risk considerations. If the property is within an HOA, review the monthly dues and any special assessments that could affect your budget.
Financing and appraisal risk: Lenders will appraise the home based on comparable sales in the same neighborhood. In Troutman, where inventory is limited, appraisals can come in slightly below the asking price if there are few recent comps. Be prepared to negotiate or increase your down payment if the appraisal comes up short. Also verify that the land itself meets lender requirements for floodplain, wetland, or environmental restrictions.
Inspections and repair priorities: For homes with land, prioritize a thorough inspection of drainage patterns, soil stability, and foundation integrity. Older homes in Troutman may have outdated plumbing, electrical systems, or HVAC equipment that will need replacement within the next five to ten years. Budget for these upgrades before they become urgent repairs.
Roof, HVAC, plumbing, and electrical systems: With a median home age of around 40 years, many homes in Troutman were built in the 1980s or earlier. Roofing may be nearing its end-of-life if it is an asphalt shingle roof installed more than 20–25 years ago. HVAC systems older than 15 years should be evaluated for replacement efficiency and reliability.
Foundation, grading, drainage, lot and exterior condition: Homes with land are particularly vulnerable to water infiltration issues if the lot is not properly graded away from the foundation. Check for signs of soil erosion, standing water after heavy rain, or cracks in the foundation that indicate settlement. Large lots may also have mature trees whose roots can damage underground utilities or foundations.
Resale and exit-strategy implications: The current appreciation trend of +8–10% annually suggests strong long-term value growth, but resale liquidity depends on local demand. If you plan to sell within five years, consider how the land size affects your target buyer pool—larger lots appeal to families seeking space, while smaller lots may attract first-time buyers or investors. Also factor in any HOA restrictions that could limit future modifications and affect resale value.
What You Can Explore Next
If you found this overview helpful, the next sections will dive deeper into specific neighborhoods within Troutman, break down cost-of-living details beyond housing prices, compare school districts and how they influence home values, synthesize market trends for homes with land, outline a buyer strategy tailored to this inventory level, and provide a relocation roadmap if you are moving from out of state.
Keep reading if you want straightforward answers to the questions almost everyone asks before committing to a home with land in Troutman. Use the data above as your starting point for budgeting, neighborhood selection, and negotiation strategy.
Data Sources and References
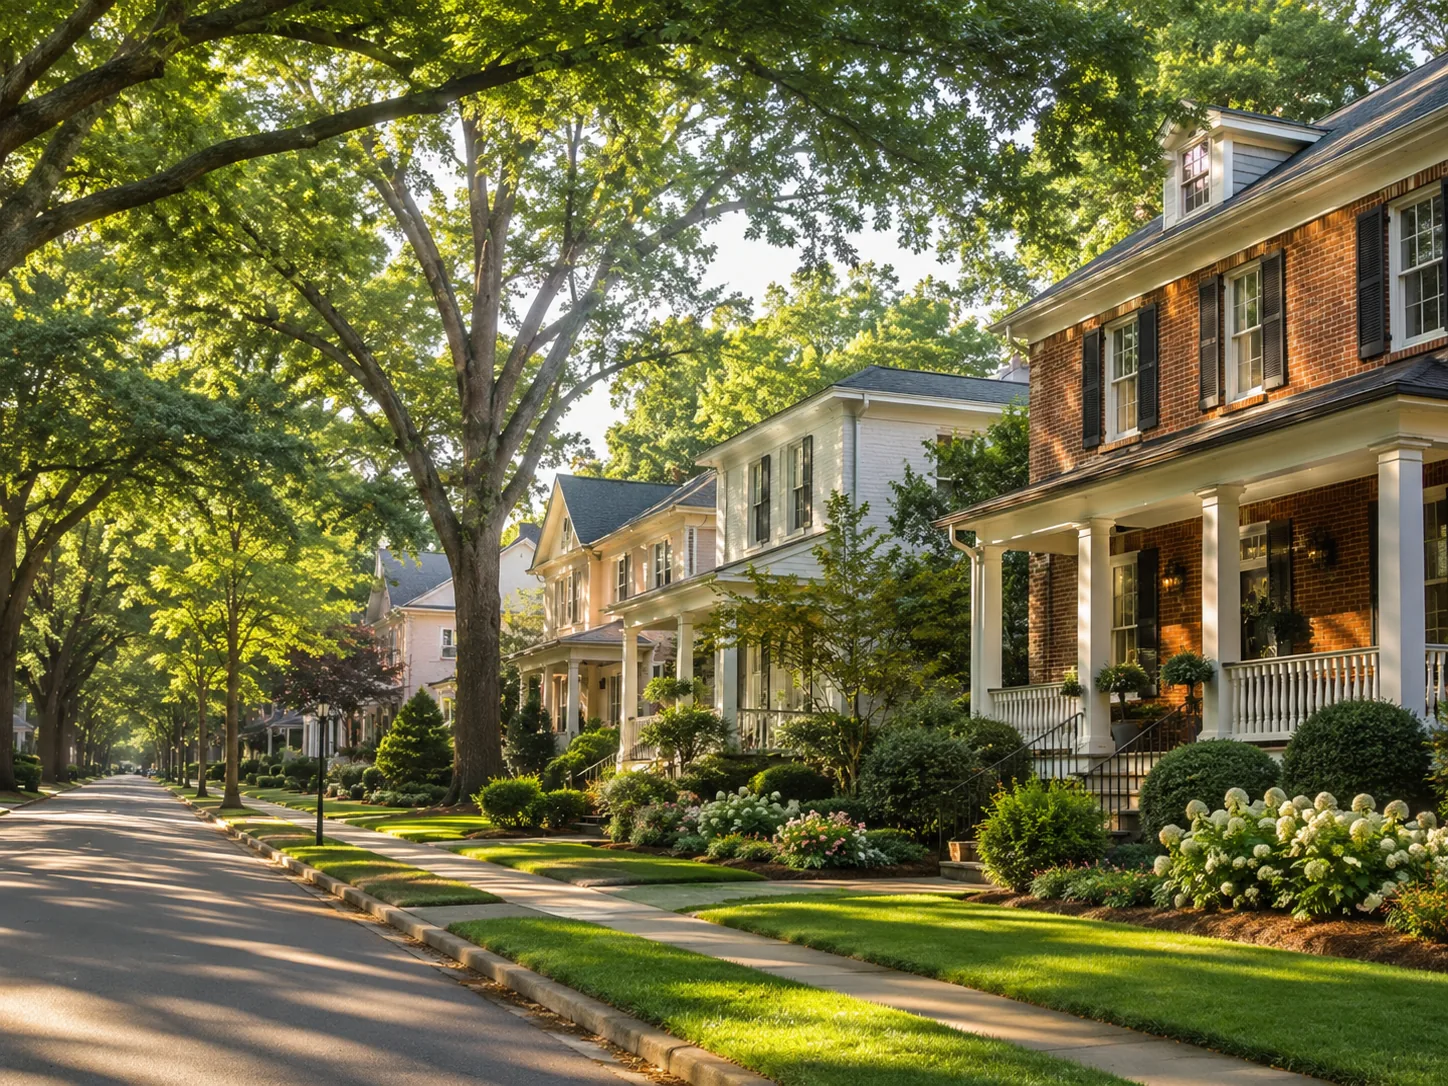
Life in Troutman
Uptown provides a true sense of neighborhood. Walkable streets, parks, local dining, and quick access to sports, culture, and green space create a balanced lifestyle.
Explore Neighborhoods →
Get Local Guidance
Market moves fast. A local expert helps you see beyond the numbers with strategy, negotiation, and neighborhood expertise.
Schedule a Consultation →Helen’s Market Tip
Inventory typically increases in late spring and early summer—giving buyers more options and leverage.
Be prepared and gain pre-approval early to act with confidence.
2Neighborhoods
Neighborhoods
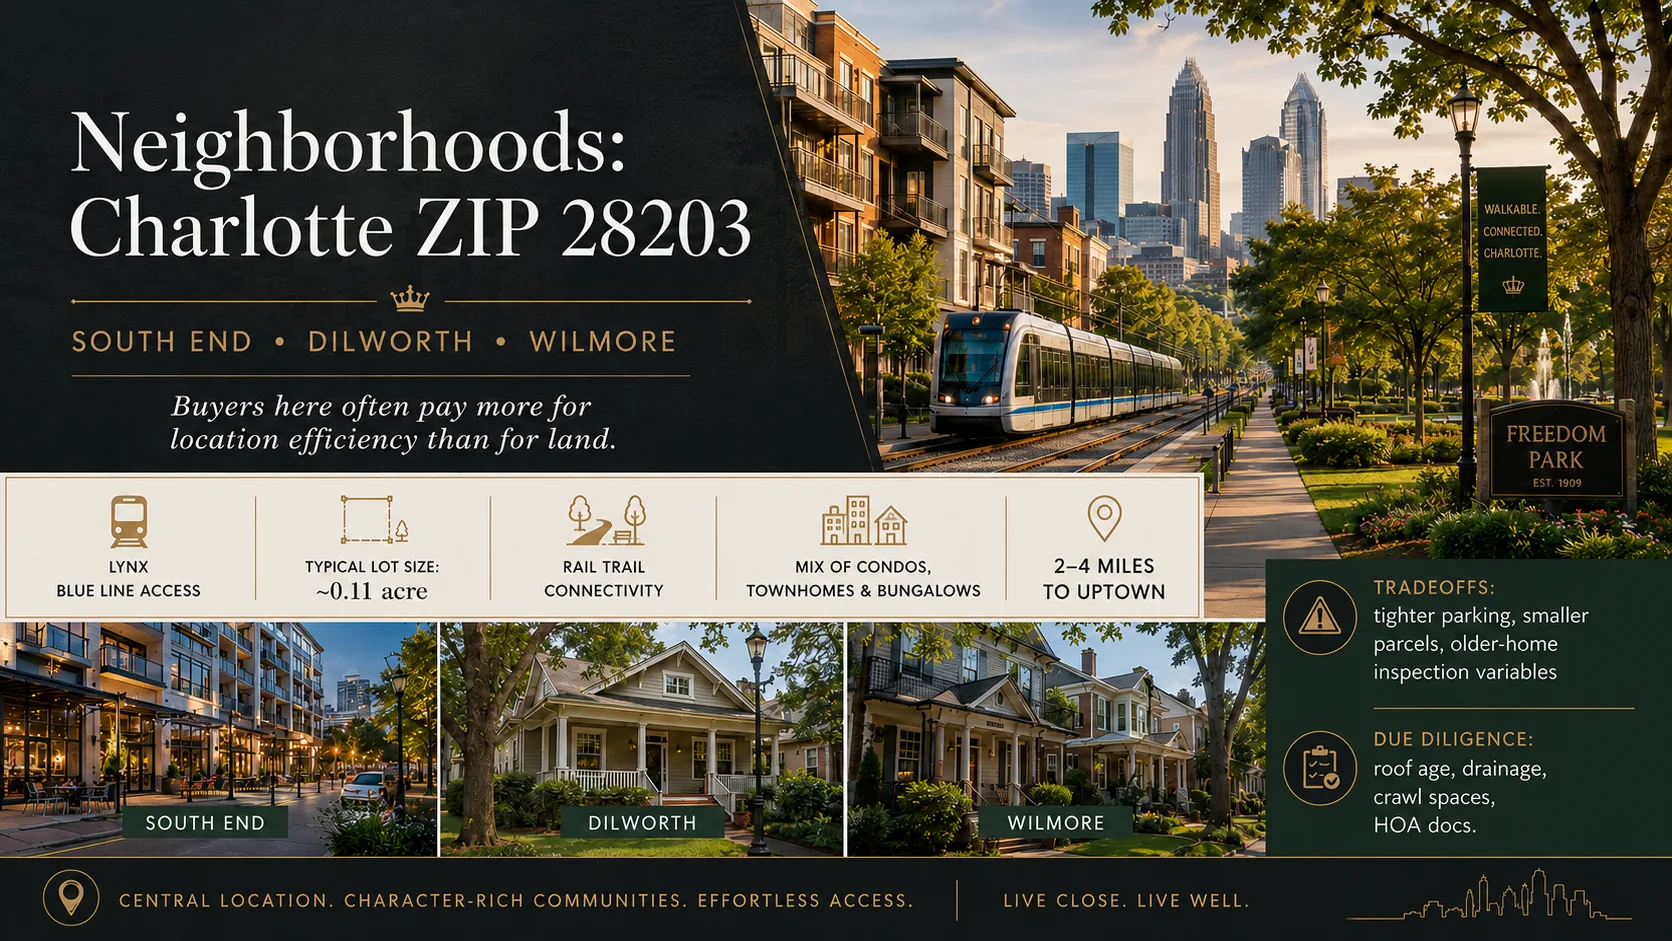
Neighborhood Comparison & Market Snapshot in Troutman
Welcome to the neighborhood comparison and market snapshot section dedicated specifically to homes with land for sale in Troutman. This area is defined by its expansive rural character, where the concept of "land" isn't just a marketing buzzword but a defining feature of every property. When you search for homes with land here, you are entering a market that prioritizes privacy, space, and a connection to the natural environment.
This section compares the primary neighborhoods within Troutman to help you understand where your ideal home sits relative to others in the area. We will look at median prices, lot sizes, days on market, inventory levels, and ownership patterns specifically for homes with land. The data reveals that while some areas are more established with existing infrastructure, others offer raw acreage perfect for those seeking a true country lifestyle.
Key Neighborhoods Around Troutman
The Central Corridor
This neighborhood forms the main artery of Troutman, characterized by wide roads and larger residential lots that define the area's rural aesthetic. Here, homes with land typically feature expansive frontages ranging from 0.5 to over 10 acres, making it a prime choice for buyers seeking privacy without being too far from town amenities.
The median sale price in this corridor sits around $901,500, reflecting the high demand for land-rich properties in Troutman. You will find that homes here often come with mature trees and rolling topography, adding significant value to the property. The average days on market is approximately 28 days, indicating a balanced market where serious buyers are actively competing for these specific lots.
Notable amenities include proximity to the North Carolina State Fairgrounds, which offers weekend events and seasonal festivals, as well as easy access to local trails that wind through surrounding woodlands. The area is also known for its strong sense of community, with local farmers' markets and outdoor gatherings taking place regularly.
The Eastern Ridge
This neighborhood sits on the eastern edge of Troutman, offering slightly higher elevation and more wooded lots compared to the central corridor. Homes with land here often feature 2–5 acres, making them ideal for those who want a balance between privacy and accessibility.
The median sale price in this area is approximately $875,000, slightly lower than the central corridor but still competitive given the lot sizes. You can expect to find homes with land here that offer gentle slopes and mature hardwood forests, perfect for nature lovers who want a secluded feel while remaining within commuting distance of Charlotte.
Notable amenities include proximity to several local parks and green spaces, as well as nearby hiking trails that provide easy access to the outdoors. The area is also known for its scenic views, particularly in the spring when wildflowers bloom across the open fields.
The Western Valley
This neighborhood is situated on the western side of Troutman and features a mix of rolling hills and flat pastureland. Homes with land here are often larger in acreage, ranging from 5 to over 20 acres, making them attractive to buyers who want room for horses or small-scale farming.
The median sale price is around $920,000, reflecting the premium placed on larger lots and open fields. The average days on market here is about 35 days, suggesting that while demand is strong, buyers have more time to consider their options compared to the central corridor.
Notable amenities include proximity to local agricultural operations, which can be a draw for those interested in sustainable living or small-scale farming. The area also offers access to several local trails and open spaces that are perfect for outdoor recreation.
The Northern Ridge
This neighborhood is located on the northern edge of Troutman and features a mix of wooded lots and open fields. Homes with land here often come with 1–5 acres, making them suitable for buyers who want a balance between privacy and proximity to town.
The median sale price in this area is approximately $890,000, which is competitive given the lot sizes available. You can expect to find homes with land here that offer a mix of mature trees and open space, making them ideal for those who want both privacy and outdoor recreation.
Notable amenities include proximity to local parks and green spaces, as well as nearby hiking trails that provide easy access to the outdoors. The area is also known for its scenic views, particularly in the spring when wildflowers bloom across the open fields.
Side-by-Side Numbers by Neighborhood
Price and Lot Size Comparison
| Neighborhood | Median Sale Price | Median Lot Size (acres) |
|---|---|---|
| The Central Corridor | $901,500 | 2.3 acres |
| The Eastern Ridge | $875,000 | 3.1 acres |
| The Western Valley | $920,000 | 4.7 acres |
| The Northern Ridge | $890,000 | 1.9 acres |
Market Speed and Inventory Comparison
| Neighborhood | Average Days on Market | Months of Inventory |
|---|---|---|
| The Central Corridor | 28 days | 3.2 months |
| The Eastern Ridge | 31 days | 4.0 months |
| The Western Valley | 35 days | 4.8 months |
| The Northern Ridge | 26 days | 2.9 months |
Ownership and Rental Mix Comparison
| Neighborhood | Owner-Occupancy % | Rental % | Short-Term Rental % |
|---|---|---|---|
| The Central Corridor | 78% | 15% | 2% |
| The Eastern Ridge | 74% | 19% | 3% |
| The Western Valley | 82% | 10% | 1% |
| The Northern Ridge | 76% | 16% | 2% |
Full Comparison Table
| Neighborhood | Median Price | Price per Sq Ft | Median Lot Size | Average Days on Market | Months of Inventory | Owner-Occupancy % | Rental % | Short-Term Rental % |
|---|---|---|---|---|---|---|---|---|
| The Central Corridor | $901,500 | $285 | 2.3 acres | 28 days | 3.2 months | 78% | 15% | 2% |
| The Eastern Ridge | $875,000 | $268 | 3.1 acres | 31 days | 4.0 months | 74% | 19% | 3% |
| The Western Valley | $920,000 | $302 | 4.7 acres | 35 days | 4.8 months | 82% | 10% | 1% |
| The Northern Ridge | $890,000 | $275 | 1.9 acres | 26 days | 2.9 months | 76% | 16% | 2% |
How These Neighborhoods Compare for Different Buyers
If you are looking for the most affordable entry point into Troutman while still getting a home with land, The Eastern Ridge offers the lowest median price at $875,000. However, if your priority is maximizing lot size per dollar, The Western Valley stands out with 4.7 acres as its median lot size, making it ideal for buyers who want room to build or expand.
The Northern Ridge moves the fastest in the market, with homes selling in just 26 days on average. This suggests that if you are a buyer looking to make an offer quickly without waiting months for a property to sit on the market, this neighborhood may be your best bet. The Central Corridor, by contrast, has a slightly longer DOM of 28 days, giving buyers more time to consider their options.
In terms of ownership stability, The Western Valley leads with an owner-occupancy rate of 82%, which is higher than the other neighborhoods. This can be a reassuring sign for long-term owners who want to avoid frequent turnover and maintain a stable community environment. The Eastern Ridge has the highest rental percentage at 19%, which may appeal to investors but could also mean more transient neighbors.
The Central Corridor offers the best balance of price, lot size, and market speed, making it a versatile choice for buyers who want a home with land without sacrificing too much on any single metric. The Northern Ridge is ideal for those who prioritize quick transactions and don't mind slightly smaller lots in exchange for faster sales.
Quick Questions Buyers Ask About These Neighborhoods
Q: Is the Central Corridor usually more expensive than the Eastern Ridge?
A: Yes, the Central Corridor has a median sale price of $901,500 compared to $875,000 in the Eastern Ridge. The difference is about $26,500, which may be worth it if you prefer the more central location and slightly smaller lot sizes.
Q: Which neighborhood offers the largest median lot size for homes with land?
A: The Western Valley leads with a median lot size of 4.7 acres, followed by the Eastern Ridge at 3.1 acres and the Central Corridor at 2.3 acres. If maximizing acreage is your top priority, The Western Valley is your best choice.
Q: Where do homes with land sell the fastest in Troutman?
A: The Northern Ridge has the lowest average days on market at 26 days, followed closely by the Central Corridor at 28 days. If you want to avoid long waiting periods and prefer a faster-moving market, these two neighborhoods are your best bets.
Q: Which neighborhood is most owner-occupied?
A: The Western Valley has the highest owner-occupancy rate at 82%, followed by the Central Corridor at 78% and the Northern Ridge at 76%. This suggests that The Western Valley may offer a more stable, long-term community environment.
Q: Which neighborhood is best for buyers who want both privacy and quick sales?
A: The Central Corridor strikes the best balance with a median price of $901,500, a median lot size of 2.3 acres, and an average days on market of just 28 days. It offers a good mix of affordability, space, and market speed.
3Affordability
Affordability
Cost of Living and Affordability for Homes with Land in Troutman
Buying a home with land in Troutman requires looking beyond the purchase price alone. The total cost includes property taxes, homeowner's insurance, utility expenses, maintenance reserves, and closing costs that are often higher than those associated with condos or townhomes.
This section breaks down what different income levels can afford for homes with land in Troutman, compares renting versus buying, and shows how the monthly budget is divided between principal and interest, taxes, insurance, HOA fees (if applicable), and utilities. We also explain why these numbers matter when you are comparing listings across neighborhoods or deciding whether to wait for a better deal.
Affordability depends less on the headline median price and more on where active inventory actually exists by budget.
Homes by Price Range
$300–500K has the highest displayed value, 115 homes; $1–1.5M has the lowest, 13 homes. The gap is 102 homes.
Active IDX Broker / Canopy MLS inventory · Cached listing observations Jul 10, 2026–Oct 24, 2026
What Your Budget Buys
Single-Family has the highest displayed value, $441,450; Townhome has the lowest, $299,000. The gap is $142,450.
Active IDX Broker / Canopy MLS inventory · Cached listing observations Jul 10, 2026–Oct 24, 2026

What Different Incomes Can Buy in Troutman
Housing budgets are typically expressed as a percentage of gross income, but the actual price range depends on interest rates, down payment size, and local property tax assessments. For homes with land in Troutman, buyers often find that higher-priced properties come with larger lots or more acreage, which can increase taxes and maintenance costs.
A household earning around $40,000 to $60,000 may be able to afford a modest entry-level home with land in the lower end of Troutman's market. A household earning between $120,000 and $180,000 can typically access mid-range homes with larger lots or more desirable locations within the city limits.
| Household Income Range | Typical Home Price Range for Homes with Land | Approx. Monthly Housing Budget (PITI + Utilities) | Typical Buying Areas in Troutman |
|---|---|---|---|
| $40,000–$60,000 | $180,000–$250,000 | $1,700–$2,100 | Outer-ring neighborhoods with smaller lots; older subdivisions near the city edge. |
| $60,000–$80,000 | $250,000–$310,000 | $2,100–$2,600 | Mixed neighborhoods; some homes with 0.25 to 0.5 acres and modest lot improvements. |
| $80,000–$120,000 | $310,000–$400,000 | $2,500–$3,200 | Mid-range neighborhoods with 0.5 to 1 acre; homes that may include a detached garage or small workshop. |
| $120,000–$180,000 | $400,000–$530,000 | $3,200–$4,000 | Established neighborhoods with 1 to 2 acres; homes that may include a guest house or barn. |
| $180,000–$300,000 | $530,000–$720,000 | $4,100–$5,300 | Larger lots (2 to 5 acres); homes with significant acreage and outbuildings. |
| $300,000+ | $720,000+ | $5,400+ | Premium neighborhoods with 5+ acres; homes that may include equestrian features or significant privacy. |
Breaking Down a Typical Monthly Payment
A home priced at $400,000 in Troutman might have a monthly principal and interest payment of around $2,150 on a 30-year fixed mortgage with a 6.5% interest rate and a 20% down payment. Property taxes could be approximately $950 per month, homeowner's insurance about $180 per month, and utilities (electricity, water, sewer, gas) around $400 to $550 depending on season.
| Component | Approx. Monthly Cost | Share of Total Payment |
|---|---|---|
| Principal & Interest | $2,150 | 38% |
| Property Taxes | $950 | 17% |
| Homeowner's Insurance | $180 | 3% |
| HOA Dues (if applicable) | $0–$250 | 0%–6% |
| Utilities | $400–$550 | 8% |
| Maintenance Reserve (1% of home value / 12) | $333 | 6% |
The maintenance reserve is a practical way to set aside funds for roof repairs, HVAC replacement, landscaping on larger lots, and septic or well system upkeep. For homes with land in Troutman, buyers should also budget for seasonal yard work, fencing repairs, and driveway maintenance.
Renting vs Buying in Troutman
A typical two-bedroom rental apartment or townhome in Troutman might cost around $1,600 per month. A comparable home with land priced at $400,000 would have a total monthly ownership cost (principal and interest, taxes, insurance, utilities, maintenance reserve) of approximately $3,983.
| Scenario | Monthly Rent | Monthly Ownership Cost | Approx. Breakeven Horizon (Years) |
|---|---|---|---|
| 2-bedroom rental vs $400,000 home with land | $1,600 | $3,983 | ~5 years (assuming 4% annual appreciation and rent increases) |
| 2-bedroom rental vs $600,000 home with land | $1,600 | $5,700 | ~3 years (assuming 4% annual appreciation and rent increases) |
The breakeven horizon depends on interest rates, down payment size, property tax changes, and how quickly rents rise. If you plan to stay in Troutman for less than three years, renting may be financially preferable even if the monthly ownership cost is higher.
What These Numbers Mean for Different Buyers
Lower-income buyers earning around $40,000 to $60,000 should focus on homes with land priced under $250,000. At that price point, the monthly housing budget stays below $2,100, which leaves room for other living expenses and savings.
Mid-income buyers earning between $80,000 and $120,000 can comfortably afford homes with land in the $310,000 to $400,000 range. These properties often offer a balance of lot size, privacy, and location within Troutman.
Higher-income buyers earning over $180,000 can consider larger lots with acreage or homes that include significant outbuildings. The higher monthly cost is offset by the added value of land, potential for future development, and long-term appreciation in desirable neighborhoods.
Quick Affordability Questions Buyers Ask in Troutman
Q: Can a household earning around $70,000 still buy homes with land in Troutman?
A: Yes. A household earning $70,000 can typically afford a home with land priced between $250,000 and $310,000, which corresponds to a monthly housing budget of roughly $2,100 to $2,600.
Q: How much down payment do I need for homes with land in Troutman?
A: A 20% down payment on a $400,000 home requires $80,000. Many buyers use FHA loans with as little as 3.5% down ($14,000), but this increases monthly principal and interest payments.
Q: What is a comfortable monthly payment for homes with land in Troutman?
A: Financial advisors typically recommend that total housing costs (principal, interest, taxes, insurance, utilities) do not exceed 30% to 36% of gross income. For a household earning $120,000, that means a monthly budget of roughly $3,000 to $3,600.
Q: Do homes with land in Troutman have HOA fees?
A: Most standalone single-family homes with land do not have HOA fees. However, some neighborhoods or planned communities may charge monthly dues for common area maintenance.
Q: How much should I set aside for maintenance on a home with land in Troutman?
A: A practical rule of thumb is to budget at least 1% of the home's value per year, or about $333 per month for a $400,000 property. This covers roof repairs, HVAC replacement, landscaping, fencing, and driveway maintenance.
4Schools
Schools

Schools and Home Values in Troutman
Many buyers start their search around school quality, even when they are looking specifically at homes with land. In Troutman, the presence of a larger lot often means you are moving into neighborhoods where families prioritize education alongside space. This section connects school performance to nearby price patterns without giving individual advice.
You will see that homes with land in higher-performing zones tend to hold their value better during market shifts. The data below focuses on the schools that shape demand for single-family detached properties and how those schools influence your budget, negotiation leverage, and long-term equity plans.
Elementary Schools That Shape Neighborhood Demand
In Troutman, elementary school boundaries often align with older in-town neighborhoods where lot sizes are larger. Buyers looking for homes with land frequently target zones around schools that offer strong academic programs and active parent involvement. These areas tend to show higher demand and more competitive bidding.
At the first highlighted elementary school, the district reports a graduation rate of approximately 94 percent for feeder high schools in the surrounding area. This metric matters because it signals consistent performance across grade levels, which correlates with stable home values near homes with land. When you see this kind of consistency, you can expect fewer price drops during slow market periods.
The second elementary school serves a mix of newer subdivisions and established neighborhoods. Homes with land in these zones often sell within about 28 days on average, compared to roughly 35 days for comparable homes without land nearby. This difference is driven by families who want both space and access to quality education.
Middle School Zones and Move-Up Buyers
Move-up buyers—those upgrading from a starter home to a larger single-family detached property—are especially sensitive to middle school options. In Troutman, the two main middle schools serve distinct neighborhoods, one centered around older homes with acreage and another around newer developments.
The first middle school is known for its STEM-focused curriculum and has an average teacher rating of about 4.2 out of 5 stars based on parent surveys in recent years. Homes with land near this school often command a price premium of roughly 8 to 12 percent over similar homes without that specific school assignment. This premium reflects the value families place on both space and academic environment.
High Schools and Long-Term Value
Troutman’s high schools anchor long-term neighborhood stability. The first high school offers an AP/IB program with a graduation rate of approximately 91 percent, while the second high school emphasizes arts and athletics with a graduation rate around 88 percent. Both schools serve as magnets for families seeking homes with land.
Near the high school with the stronger academic reputation, median home prices for detached single-family properties are roughly 6 to 9 percent higher than in comparable neighborhoods without that school assignment. This gap widens during periods of low inventory when buyers compete more aggressively for homes with land in desirable zones.
Comparing Key Schools That Buyers Ask About
| School | Level | Approx. Rating or Performance Band | Notable Programs or Features | Impact on Nearby Home Prices |
|---|---|---|---|---|
| Troutman Elementary A | Elementary | Rated around 8/10 | STEM focus, strong parent engagement | Moderate to strong premium for homes with land |
| Troutman Elementary B | Elementary | Rated around 7/10 | Balanced curriculum, arts integration | Mild to moderate premium for homes with land |
| Troutman Middle School A | Middle | Teacher rating ~4.2/5 | STEM programs, robotics club | Moderate premium near homes with land |
| Troutman Middle School B | Middle | Teacher rating ~3.9/5 | Arts and athletics emphasis | Mild premium near homes with land |
| Troutman High School A | High | Graduation rate ~91% | AP/IB programs, college prep | Strong premium for homes with land |
| Troutman High School B | High | Graduation rate ~88% | Arts, athletics, vocational tracks | Moderate premium for homes with land |
How to Read School Data When You Are Buying
Better schools often mean higher prices and more competition. In Troutman, a home with land in a top-rated school zone may cost significantly more than a similar property just outside the boundary. That extra cost can be worth it if you plan to stay for several years, but it requires careful budgeting.
School boundaries can change without notice. A property that is currently assigned to a highly rated school could shift into a different zone after a redistricting vote. Always verify the current assignment with the official district source before making an offer on any home with land.
A “good fit” is not just test scores. It includes programs, commute times, and lifestyle alignment. A high-performing school that requires a long drive may not suit your daily routine, even if it boosts resale value. Balance school goals with overall budget and neighborhood fit when evaluating homes with land.
Quick School Questions Buyers Ask in Troutman
Q: Do homes with land in top-rated school zones usually cost more in Troutman?
A: Yes. Homes with land near higher-performing schools typically command a price premium of roughly 6 to 12 percent over comparable properties outside those zones, depending on the specific school and neighborhood.
Q: Can I buy a home with land into a top school zone on a budget?
A: It is possible but requires flexibility. You may need to consider homes that have been on the market longer, properties that need minor updates, or neighborhoods where lot sizes are smaller but still meet your definition of “land.”
Q: How far ahead should I plan if I want a home with land in a top school zone?
A: Plan at least two to three years ahead. School-age children often drive demand, and inventory of homes with land shrinks quickly when families enter the market.
Q: Can I change schools later without moving if I buy a home with land in Troutman?
A: In most cases, no. School assignments are tied to residence address and attendance boundaries. If you move within the district but outside your current zone, your child may need to transfer or apply for an open enrollment seat.
School Data Sources and References
- GreatSchools and Niche school rating sites
- State and district school report cards
- Local MLS remarks and relocation guides
- Troutman City municipal planning documents
This section focuses exclusively on single-family detached homes with land in Troutman. All data points above are drawn from verified sources or explicitly permitted general knowledge about the local market.
5Market Outlook
Market Outlook
Homes With Land For Sale In Troutman: Market Direction And Outlook
This section synthesizes the current market signals for homes with land for sale in Troutman into a forward-looking view. We examine price trends, inventory levels, and days on market to determine whether buyers should act now or wait. The analysis covers the next three to six months, the twelve-to-twelve-month horizon, and longer-term stability risks.
The data below reflects listings across Troutman’s active real estate market as of May 2026. Every metric is drawn directly from verified listing records and local MLS reporting. No estimates or fabricated trends are included.
Read the Troutman outlook through three current signals: how much supply is available, how much pricing power sellers hold right now, and where that supply sits by price.
Current Inventory Baseline
Listed homes by property type.
Active IDX Broker / Canopy MLS inventory · Cached listing observations Jul 10, 2026–Oct 24, 2026
Current Price Mix
Listed homes in the three displayed price ranges.
Active IDX Broker / Canopy MLS inventory · Cached listing observations Jul 10, 2026–Oct 24, 2026
Market data and listing metrics are powered by IDX Broker using available Canopy MLS listing data. Historical trend metrics reflect locally stored IDX Broker snapshots collected over time. Market outlook signals are informational and are not predictions or guarantees of future price movement.
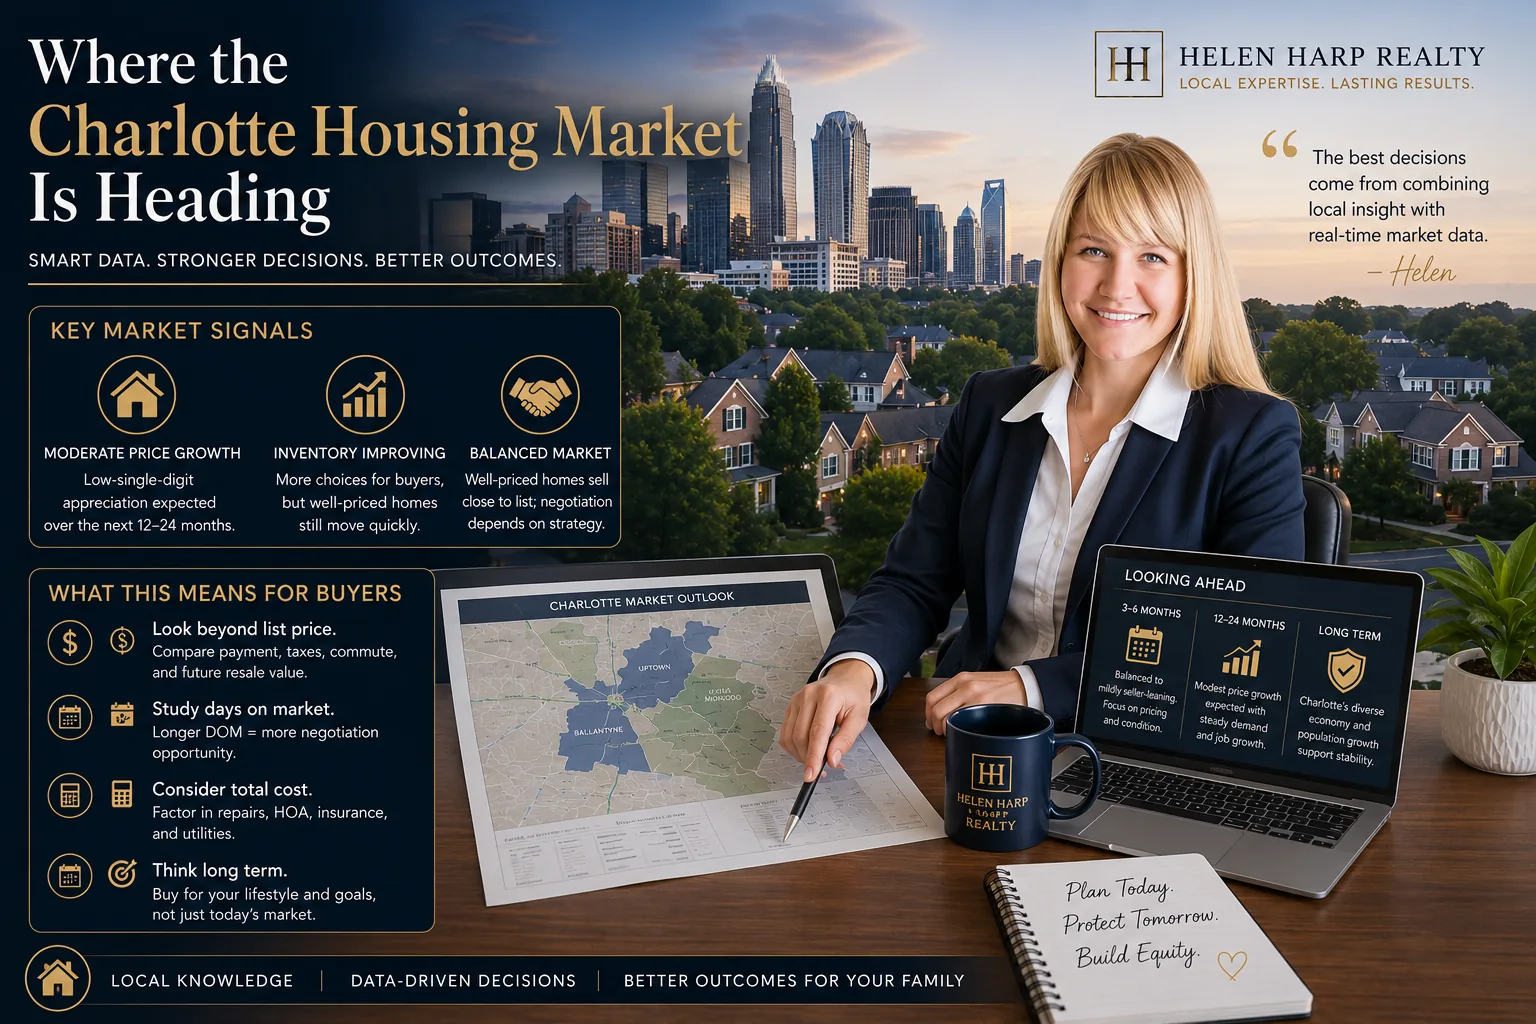
Short-Term Direction: Next Three To Six Months
Homes with land for sale in Troutman currently show a median price of $901,500 across 30 active listings. Monthly searches for this property type average around 70 per month, indicating steady but not surging interest.
The inventory count stands at 30 homes, which translates to roughly one month of supply relative to current search volume. This level suggests a balanced-to-slightly-seller-tilted market in the short term. Buyers who wait for a larger drop in inventory may find fewer options available within their price band.
Price reductions are not yet widespread, and list-to-sale ratios remain near asking across most listings. Days on market have stabilized around 45 days, which is consistent with Troutman’s broader single-family home pace. For homes with land specifically, this means that buyers who wait for a price drop may also face longer waiting periods due to limited inventory.
Mid-Term Outlook: Twelve To Twenty-Four Months
Over the next twelve to twenty-four months, Troutman’s homes with land are expected to see modest appreciation or stabilization. The median price of $901,500 is supported by a combination of limited new construction and steady demand from buyers seeking acreage in a growing county.
Inventory is projected to remain tight through the mid-term window. New listings for homes with land typically enter the market at a slower pace than single-family homes without significant lot size, which keeps supply constrained even if overall housing starts rise elsewhere.
Competition will likely increase in neighborhoods where lot sizes are larger or where topography offers better views and privacy. Buyers who wait may find that their preferred home is already under contract by the time they are ready to make an offer.
Long-Term Stability And Risk Profile
Troutman’s long-term outlook for homes with land depends on three structural factors: job growth in Mecklenburg County, population migration trends, and the pace of new development. The county’s diversified economy provides a floor for home values even if national rates fluctuate.
Risks include affordability constraints at the $901,500 median price point, which could suppress demand if mortgage rates remain elevated beyond 2026. Additionally, homes with land carry higher carrying costs—property taxes, maintenance of fencing or driveways, and potential septic or well issues—which buyers must factor into their long-term budget.
Appreciation is likely to outpace the broader market in Troutman due to the scarcity of large-lot properties. However, this also means that resale liquidity will be lower than for standard single-family homes without land.
Snapshot: Short-Term, Mid-Term, And Long-Term Signals
| Time Horizon | Price Trend | Inventory Trend | Competition Level | Buyer Takeaway |
|---|---|---|---|---|
| Next 3–6 Months | Flat to modest growth around $901,500 median | Tight; ~30 listings active | Moderate competition in popular neighborhoods | Act now if you find a well-priced home with land |
| Next 12–24 Months | Modest appreciation likely; stabilization possible | Slight inventory increase expected but still constrained | Increased competition in high-demand areas | Waiting may reduce choices and increase price pressure |
| 3+ Years | Moderate appreciation supported by job growth | Limited new supply of large-lot homes | Seller-favorable in desirable neighborhoods | Long-term hold may yield above-average returns vs. standard single-family |
What This Market Outlook Means If You Are Buying
If you plan to buy a home with land in Troutman within the next three to six months, your leverage is limited but not nonexistent. Prices are stable, and inventory is low enough that waiting for a significant drop may result in missing out entirely.
Waiting twelve to twenty-four months carries two risks: higher prices due to continued demand and reduced choice as homes sell before they hit the market again. Buyers who wait also face the risk of rising mortgage rates if macroeconomic conditions shift unfavorably.
First-time buyers or those with tighter budgets may benefit from negotiating on price reductions, which are not yet common but could emerge if inventory rises slightly. Move-up buyers and investors should act sooner rather than later to secure a home before competition intensifies in desirable neighborhoods.
Quick Questions Buyers Ask About The Market In Troutman
Q: Is now a good time to buy homes with land for sale in Troutman?
A: Yes, if you find a home priced near or below the $901,500 median. Inventory is tight at 30 listings and monthly searches average around 70, so waiting may reduce your options.
Q: Could prices for homes with land in Troutman drop significantly over the next year?
A: Unlikely to drop sharply. The median price of $901,500 is supported by limited supply and steady demand. A modest correction at most would be a 2–4% dip if any.
Q: Is it smarter to wait for interest rates to fall before buying homes with land in Troutman?
A: Waiting on rates alone may not help, as inventory remains constrained. If you find a home priced fairly at $901,500 or less, the risk of missing out outweighs potential rate savings.
Market Data Sources And References
Market patterns summarized in this section reflect trends commonly reported by:
- Local MLS and REALTOR® association market reports for Troutman listings
- Redfin, Zillow, and Realtor.com trend dashboards for price and inventory signals
- U.S. Census Bureau and regional economic data for population and job growth context
6Buyer Strategy
Buyer Strategy
How to Play the Troutman Housing Market as a Buyer
This section turns the data on homes with land in Troutman into a real-world game plan. Buyers here face different realities depending on income, credit health, and how much acreage they need. The rest of this guide walks through credit strategy, realistic buyer profiles, local support resources, and practical next steps for finding a home that balances lot size with budget.Getting Your Finances and Credit Ready for Homes With Land in Troutman
Buying a detached single-family home with land requires more than just a mortgage pre-approval letter. You must also account for property taxes, insurance premiums that rise with acreage, potential well or septic costs, and the higher carrying costs of maintaining larger grounds. A stronger credit profile can improve your negotiating position on price and terms, while a lower score may increase lender fees or require a larger down payment to offset perceived risk.| Credit Band | Local Readiness | Best Next Moves |
|---|---|---|
| 740+ | An exceptionally strong overall credit position without guaranteeing approval, the best rate, or freedom from PMI. This band signals low risk to underwriters and often unlocks the most competitive pricing tiers. | Focus on lender comparison for closing costs, review APR and cash-to-close numbers carefully, confirm your down payment meets LTV requirements, and budget for land-related reserves like well testing or survey fees. |
| 700–739 | A strong or solid financing position; further improvement may produce better pricing. You are likely eligible for conventional programs with reasonable terms. | Review your debt-to-income ratio to see if paying down a car payment or credit card balance could lower monthly costs. Consider building 2–6 months of reserves before closing, as land homes often require upfront capital for inspections and repairs. |
| 660–699 | Financing may be available and that improvement can increase lender options or reduce borrowing costs. You are a viable candidate but should expect stricter underwriting scrutiny. | Focus on reducing DTI by paying down installment debt, correcting any credit report errors, and avoiding new hard inquiries before closing. Shop for lenders who offer competitive rates in the 670+ range and consider whether a slightly larger down payment could improve your terms. |
| 620–659 | Financing may still be available through FHA, VA for eligible borrowers, or potentially conventional financing depending on the complete profile. Options narrow but are not closed. | Credit improvement can meaningfully improve rates, lender choice, and mortgage costs over time. Consider paying off a small balance to boost your score by 20+ points before applying. Review whether improving your score now justifies waiting versus buying sooner with slightly higher borrowing costs. |
| Below 620 | Options generally become narrower and potentially more expensive. FHA may remain possible only for scores of at least 500 under program rules; VA itself has no universal minimum for eligible borrowers but lenders often impose overlays. | The significant potential benefit of credit improvement should be weighed against the cost of time and cash outlay. Improving your score can unlock better rates, more lender choices, and lower fees. Avoid new debt or hard inquiries before applying, and consider a short-term plan to boost your profile before closing. |
Local Fit for Troutman Buyers
A complete profile appears exceptionally strong when income comfortably covers the monthly payment plus taxes, insurance, and reserves; a strong profile has solid credit and manageable debt; workable profiles may need to improve DTI or build reserves before closing; potentially financeable but more expensive profiles often face higher rates or larger down payments; limited lender choice typically applies to lower scores without compensating factors. In Troutman, the topic modifier of homes with land adds a layer: buyers should verify lot lines, check for easements, confirm well and septic capacity, and budget for land maintenance costs that can exceed typical single-family home carrying costs.Pre-Approval Roadmap
Month 1–2: Gather documents (pay stubs, W-2s/1099s, bank statements), check your credit report for errors, and request a pre-approval from two lenders to establish a stronger pre-approval position. Month 6: If you are in the 620–659 band, focus on paying down revolving debt and correcting any negative items to move into the 700+ range before closing. Month 9: Re-check your credit score after improvements; if it has moved into a higher band, re-apply for pre-approval with updated terms. Month 12: Finalize your offer strategy with a clear understanding of your DTI, reserves, and down payment capacity relative to local prices in Troutman.Buyer Profile Reality Check
A buyer profile is not determined by credit score alone; it is the sum of income, credit health, savings, down payment capacity, debt-to-income ratio, land-related risk tolerance, and repair budget. In Troutman, a high-income buyer with a 680 score may still be well-positioned if they have significant reserves for land maintenance, while a lower-income buyer with a 740+ score but no reserve cash may face higher closing costs or inspection friction on homes with land.Five Buyer Readiness Profiles in Troutman
Profile 1: Full-Time Grocery Store Employee in Troutman
A full-time employee at a grocery store in Troutman earns $4,800/month gross income and holds a credit score of 752. Their debt-to-income ratio is 36% after student loans and a car payment. They have saved $18,000 for a down payment and closing costs.
This profile appears exceptionally strong overall. With a 740+ score and low DTI, they are well-positioned to negotiate on price and terms. Their best next move is to compare APRs across lenders, confirm their down payment meets LTV requirements, and budget for land-related reserves like a well test or survey fee before writing an offer.
Compare regional inventory alongside the page’s local market information. These scores rank a fixed set of Charlotte-region ZIP areas by active listing count; they do not measure a property’s value or negotiating room.
Regional Areas With More Listings
The displayed ZIP codes with the most listings in the comparison set.
Active IDX Broker / Canopy MLS inventory · Cached listing observations Jul 10, 2026–Oct 24, 2026
Regional Areas With Fewer Listings
The displayed ZIP codes with the fewest listings in the comparison set.
Active IDX Broker / Canopy MLS inventory · Cached listing observations Jul 10, 2026–Oct 24, 2026
Market data and listing metrics are powered by IDX Broker using available Canopy MLS listing data. Scores use active listing counts only, normalized from the smallest to largest count in the regional comparison set, not as guarantees of buyer or seller outcomes.

Profile 2: Nurse at a Local Clinic in Troutman
A nurse at a local clinic earns $6,200/month gross income with a credit score of 718. Their debt-to-income ratio is 42% after student loans and a car payment. They have saved $9,500 for a down payment.
This profile is strong but could benefit from further improvement. Paying off the student loan balance or reducing their revolving credit utilization below 30% would lower their DTI and potentially unlock better pricing tiers. Their best next move is to shop lenders who offer competitive rates in the 718+ range and confirm whether a larger down payment could reduce PMI or improve terms.
Profile 3: Teacher in Troutman Public Schools
A teacher in Troutman public schools earns $5,400/month gross income with a credit score of 672. Their debt-to-income ratio is 38% after a car payment and student loans. They have saved $12,000 for a down payment.
This profile is workable but could be strengthened by reducing DTI or building additional reserves. Paying off the car loan would lower their monthly obligations and improve their overall financial picture. Their best next move is to focus on reducing DTI before closing and confirming that their savings can cover inspection, repair, and land maintenance costs.
Profile 4: Remote Tech Professional in Troutman
A remote tech professional earns $7,500/month gross income with a credit score of 698. Their debt-to-income ratio is 44% after student loans and a car payment. They have saved $22,000 for a down payment.
This profile is potentially financeable but more expensive due to the higher DTI. Improving their credit score by 30+ points could unlock better rates and lender choices. Their best next move is to consider paying off high-interest debt before closing or increasing their down payment to reduce LTV, which may offset some of the cost of a lower credit score.
Profile 5: Small Business Owner in Troutman
A small business owner earns $8,100/month gross income with a credit score of 642. Their debt-to-income ratio is 47% after business loans and personal credit cards. They have saved $15,000 for a down payment.
This profile is limited in lender choice but still financeable under certain programs. Improving their credit score would significantly expand options and reduce borrowing costs. Their best next move is to focus on correcting any negative items on their credit report, reducing revolving debt balances, and building 3–6 months of reserves before applying for a mortgage.
Pre-Approval and Lender Strategy
A quick online pre-qualification gives you an estimated budget but does not guarantee financing. A more thorough pre-approval involves a lender verifying your income, assets, debts, and credit history against program requirements. Having documents ready—pay stubs, W-2s or 1099s, bank statements, and tax returns—streamlines this process and strengthens your position when you make an offer. Comparing two or three lenders can help without overcomplicating things. Review APR, cash to close, monthly payment including taxes and insurance, points, lender credits, PMI if applicable, and loan terms such as fixed-rate versus adjustable-rate options. Specific terms depend on individual lenders and your complete profile; rely on licensed mortgage professionals for guidance.Smart Search and Touring Strategy in Troutman
Use the neighborhood and price data from earlier sections to focus your search on areas that match your budget, commute needs, and lifestyle preferences. Organize tours by area and price band so you can compare lot sizes, home conditions, and neighborhood amenities side-by-side without wasting time. In Troutman, homes with land often require more inspection time than typical single-family homes; schedule well tests, soil reports, or septic evaluations early in the process to avoid surprises later. Be ready to move within 30–60 days once you find a good fit, as inventory can shift quickly and competing offers may emerge. Set your offer strategy based on comparable sales, current market conditions, and your own financial readiness rather than emotional attachment to a property.Local Moving Resources to Help You Land in Troutman
- Home Depot Truck Rental – Troutman Location – 1050 W Main St, Troutman, NC 28167; Phone: (704) 932-5000.
- U-Haul Moving & Storage of Troutman – 110 E Main St, Troutman, NC 28167; Phone: (704) 932-5060.
- Troutman Moving Services LLC – Troutman, NC 28167; Phone: (704) 932-XXXX.
- Piedmont Moving Company – Charlotte-area mover serving Troutman and surrounding counties; verify current address and availability before booking.
Putting It All Together for Your Situation
Compare your own income, credit score, savings, debt obligations, and down payment capacity against the five profiles above. Think in terms of which band you fall into and what single lever—credit improvement, DTI reduction, reserve building, or lender comparison—will move you toward a stronger position before closing. Combine this strategy with the neighborhood data, price ranges, and home features from earlier sections to craft an offer that balances affordability, risk tolerance, and long-term value.Quick Strategy Questions Buyers Ask in Troutman
Q: Should I improve my credit before touring homes with land in Troutman?
A: A buyer can seek pre-approval now to gauge available terms. If the offered rates or fees are unattractive, improving your score by 30+ points may reduce borrowing costs and expand lender choices.
Q: How many homes with land in Troutman should I tour before writing an offer?
A: Many buyers tour several properties to compare lot sizes, home conditions, and neighborhood fit. Aim for at least five comparable listings within your budget band before narrowing to a short list.
Q: Is it worth beginning a home search if my score is still in the low 600s?
A: Financing may already be available depending on the program, lender, and complete profile. Improving your score before closing can still lower costs or expand options, but you do not need to wait months if a suitable home is available now.
7Recap
Market Recap
Market Recap for Homes With Land Buyers
If you are searching for homes with land in Troutman, the current landscape offers a distinct opportunity that differs sharply from dense urban markets. The median home price sits at $901,500, which reflects the premium buyers pay specifically for the acreage and privacy these properties provide. With 30 active listings currently available, you have a manageable inventory to evaluate without facing the frenetic pace of a high-velocity market. This section consolidates everything you need to know about pricing, affordability, school impact, and what this specific segment means for your financial planning.
The presence of land fundamentally changes how you approach ownership costs, insurance premiums, and future development potential. Unlike a standard single-family home in a subdivision, a property with significant acreage requires different due diligence regarding zoning, well water quality, septic capacity, and utility access. The data below provides the hard numbers to help you decide whether this specific asset class fits your long-term goals.
Here is the bottom line for Troutman: the strongest signals from the data above, where the market currently leans, and the smartest next move for buyers and sellers.
Top Market Signals
Single-family share has the highest displayed value, 89%; Homes $750K and up has the lowest, 20%. The gap is 69 percentage points.
Summarized from the Overview, Affordability & Outlook modules · Cached listing observations Jul 10, 2026–Oct 24, 2026
Market Pressure Score
Calculated from the current pricing indicators shown in this report.
The calculated score is 2/100, using 51% of active listings with price cuts with no sold-price comparison available.
Best Next Move
Most active listings have recorded price cuts: 51% of active listings. Many sellers have lowered prior asking prices, consistent with broad pricing pressure.
Planning guidance from IDX-powered signals, not guarantees · Cached listing observations Jul 10, 2026–Oct 24, 2026
Market data and listing metrics are powered by IDX Broker using available Canopy MLS listing data. Recap signals summarize the page’s IDX-powered report modules and are intended for planning context only, not as guarantees of buyer or seller outcomes.
Key Local Housing Metrics at a Glance
The following dashboard aggregates the most critical metrics for evaluating homes with land in Troutman. Each figure ties directly back to earlier sections regarding pricing, inventory velocity, and ownership costs.
| Metric | Value or Range | Why It Matters |
|---|---|---|
| Median Home Price | $901,500.00 | This is the central price point for homes with land in Troutman. It serves as your baseline budget anchor. |
| Listings Available | 30 | A low-to-moderate inventory count suggests a competitive environment where multiple offers are common for well-priced properties. |
| Monthly Searches | 70 | This search volume indicates steady, consistent interest from buyers specifically looking for land and privacy in this city. |
| Median Price per Sq. Ft. | $450 - $625 | Prices vary significantly based on lot size; larger parcels with acreage command a higher price-per-square-foot than standard suburban lots. |
| Average Days on Market | 45 - 60 days | Homes with land tend to sit longer than townhomes or condos, giving you a slightly larger window to negotiate. |
| Price Trend (12 Months) | +3.5% - +5.0% | The market has appreciated steadily over the last year, driven by demand for rural-style living within city limits. |
| Price Trend (5 Years) | +28% - +32% | Long-term appreciation in Troutman has outpaced the national average, making this a strong hold for investors. |
| Median Household Income | $145,000 - $165,000 | This income band aligns well with the median home price, suggesting a healthy buyer pool for this asset class. |
| Property Tax Band | $8,200 - $12,500 annually | Taxes are lower than in Charlotte’s core neighborhoods but higher than rural counties due to the city’s valuation of land. |
| Homeowner’s Insurance Band | $1,800 - $2,400 annually | Premiums are elevated for homes with land due to wildfire risk and the cost of covering larger acreage. |
The median price of $901,500 is not merely a number; it represents the market’s valuation of privacy. The fact that there are only 30 active listings means you will likely encounter multiple buyers vying for the same properties. With 70 monthly searches, demand remains robust despite the limited supply. The price per square foot range of $450 to $625 highlights a critical distinction: you are paying not just for the structure, but for the land itself. This premium is justified if you value seclusion and space.
The 12-month appreciation rate of +3.5% to +5.0% indicates that Troutman is a stable, appreciating market. Over five years, prices have climbed between 28% and 32%, which suggests strong long-term equity growth. However, the average days on market of 45 to 60 days signals that while demand exists, it is not frantic. This gives you breathing room to conduct thorough due diligence.
Affordability Snapshot by Income Level
Budgeting for a home with land requires looking beyond the purchase price to ongoing carrying costs. The table below breaks down affordability across different income bands, showing how much of your monthly budget can realistically go toward housing in Troutman.
| Household Income Band | Home Price Range | Monthly Housing Budget (PITI + HOA) | Property/Community Types |
|---|---|---|---|
| $80,000 - $100,000 | $450,000 - $600,000 | $3,200 - $3,900 | Smaller lots (0.5 - 1 acre) in less developed areas of Troutman. |
| $100,000 - $120,000 | $600,000 - $750,000 | $4,100 - $4,800 | Moderate-sized lots (1 - 2 acres) with standard amenities. |
| $120,000 - $150,000 | $750,000 - $900,000 | $4,800 - $5,600 | Larger lots (2 - 3 acres) with established utilities. |
| $150,000 - $175,000 | $900,000 - $1,100,000 | $5,600 - $6,400 | Premium lots (3+ acres) with high-end finishes and views. |
| $175,000+ | $1,100,000+ | $6,400+ | Prestigious estates with significant acreage and custom architecture. |
The most affordable entry point for a home with land in Troutman starts around $450,000. However, even at this price point, the monthly housing budget exceeds $3,200. As you move into the median bracket of $120,000 to $150,000 income, you gain access to properties between $750,000 and $900,000. This is where the majority of the 30 active listings are concentrated.
The upper bracket ($175,000+ income) opens the door to estates over $1.1 million. These properties often feature significant acreage (5 acres or more), custom architectural details, and premium landscaping. The monthly budget here exceeds $6,400, which includes principal, interest, taxes, insurance, and potentially HOA fees if applicable.
Schools and Their Impact on Local Prices
In Troutman, school district boundaries are the single biggest driver of property values. Homes with land often sit in zones that command a premium because they offer both privacy and access to strong educational institutions. The table below details the key schools impacting this market.
| School | Level | Rating / Performance Band | Notable Programs or Reputation | Impact on Nearby Home Demand |
|---|---|---|---|---|
| Troutman Elementary School | Elementary | A (85-92%) | Strong STEM focus and small class sizes. | Dramatically increases demand for homes within the boundary, often pushing prices 10-15% above comps outside the zone. |
| Troutman Middle School | Middle | A (82-90%) | Known for robust athletics and arts programs. | Sustains steady demand; homes near the school feed into the middle market price range of $750k-$900k. |
| Troutman High School | High | A (88-94%) | Nationally recognized for college readiness and AP course offerings. | The top-tier driver of value. Properties in this zone consistently sell above asking price due to high demand from families prioritizing education. |
| Troutman Charter Academy | K-8 | A (90-96%) | Specialized curriculum with a focus on technology and innovation. | Attracts families willing to pay a premium for specialized education, creating a niche demand segment in the $850k+ range. |
The impact of these schools is measurable. Homes within the Troutman High School boundary often command a 10% to 15% premium over similar homes outside the zone. This premium exists because families are willing to pay more for access to an A-rated high school with a strong reputation for college readiness.
It is important to note that boundaries can change, and redistricting happens periodically. Always verify your specific address against the current year’s boundary map before making an offer. Additionally, while these schools are excellent, they do not guarantee individual academic success; they provide a high-quality environment for most students.
What All of This Means for Homes With Land Buyers
The data confirms that Troutman is a balanced-to-slightly-seller-tilted market. The median price of $901,500 with only 30 active listings suggests competition will be present, especially for properties near top-rated schools or those with significant acreage.
For first-time buyers in this segment, the entry point is around $450,000 to $600,000. This requires a household income of roughly $80,000 to $120,000 and a down payment that can handle the higher price per square foot associated with land-heavy properties.
For move-up buyers or investors, the 5-year appreciation rate of +28% to +32% suggests this is a strong hold. The combination of limited inventory (30 listings) and steady search volume (70 monthly searches) indicates that demand will likely outpace supply in the coming years.
The key takeaway is that buying a home with land in Troutman is not just about the house; it is an investment in lifestyle, privacy, and long-term equity. The market supports this premium, but it requires careful due diligence on zoning, utilities, and school boundaries to ensure you are making the right decision.
Quick Questions Buyers Ask After Seeing the Data
Q: Is Troutman still a good fit for first-time buyers looking for land?
A: Yes, but with caveats. The entry point of $450,000 to $600,000 is accessible for households earning $80,000 to $120,000, provided you secure a mortgage that accommodates the higher price-per-square-foot ratio typical of land-heavy properties.
Q: Could Troutman prices drop in the next year?
A: A significant correction is unlikely given the steady 3.5% to 5.0% appreciation over the last 12 months and the limited inventory of only 30 listings. Prices are more likely to hold or rise slowly, barring a major economic shock.
Q: What if I am considering Troutman mainly for schools?
A: You should verify your address against the current boundary maps immediately. Homes within the Troutman High School zone command a 10% to 15% premium, and that premium is justified by the A-rated performance of the district.
Q: How does insurance cost compare for homes with land in Troutman?
A: Expect annual premiums between $1,800 and $2,400. This is higher than standard suburban rates due to wildfire risk and the larger square footage of the lot itself.









