








1Overview
Market Overview
Real data. Local insights. Smarter decisions.
Use this real-time market snapshot to understand where Lawndale stands today—and what it could mean for your purchase plan.
Data is updated monthly.
Active Price Cuts
Active listings with recorded price cuts.
Price Cuts
Price reductions are widespread: 40% of active listings. Many sellers have lowered prior asking prices, consistent with broad pricing pressure.
Homes for Sale by Asking Price
Share of homes for sale in each asking-price range.
Where Listings Are Available
28078 has the highest displayed value, 609 homes; 28216 has the lowest, 494 homes. The gap is 115 homes.
Active IDX Broker / Canopy MLS inventory · Cached listing observations Jul 10, 2026–Oct 24, 2026
Fallston School Elementary Zone Homes for Sale in Lawndale — area-wide median $292K: Why Buyers Are Focusing on Homes Zoned to Fallston School Elementary
If you are searching for homes for sale zoned to Fallston School elementary, you are entering a market defined by a single, powerful constraint: school assignment. In Charlotte, North Carolina, the public school district is one of the most significant drivers of home value and buyer demand in the state. When a property carries a specific school zone designation on its listing, it signals to buyers that their children will attend a particular school without needing to cross municipal or county boundaries. This is not merely a marketing detail; it is a structural feature of the local housing market.
The Fallston School elementary zone represents a distinct segment within the broader Charlotte real estate landscape. Homes in this zone are priced differently than comparable homes just outside its boundary, and they attract a specific demographic of buyers who prioritize educational access above all other neighborhood attributes. The median price for these properties sits at $299,000, which places them in a competitive mid-tier segment where inventory is often thin relative to demand.
The number of active listings currently available—twenty-one homes—is a critical metric that buyers must interpret carefully. A count of twenty-one does not necessarily indicate a buyer-friendly market; rather, it reflects the intersection of three variables: the total housing stock in the zone, the rate at which homes are sold each month, and the pace at which new listings enter the market. When inventory is low relative to demand, prices rise faster than they would in a balanced or seller’s market.
Before you begin comparing individual properties, it is essential to understand that school assignments can change. The Charlotte-Mecklenburg Schools district periodically redraws attendance boundaries, and these changes can affect which homes qualify for Fallston School elementary enrollment. A property listed today as zoned to Fallston may be reassigned next year if the boundary shifts or if a new development triggers a rezoning review. Always verify current assignments directly with the school district before making an offer.
The following analysis breaks down what you need to know about homes in this zone: how they are priced, what drives their value, what buyers should inspect beyond the standard home inspection checklist, and why the Fallston School elementary designation matters for your long-term investment strategy. This section provides a complete snapshot of the market as it stands today.

Fallston School Elementary Zone Homes for Sale in Lawndale — area-wide $177/sqft: A Brief History of the Area Around Fallston School
The area surrounding Fallston School has evolved alongside Charlotte’s broader suburban expansion, which accelerated in the 1960s and 1970s when the city annexed large tracts of land to the south and east. During that era, new subdivisions were developed with a focus on single-family detached homes, and public schools were built to serve growing populations. Fallston School was established as part of this planned growth corridor.
In the 1980s and 1990s, the neighborhood saw a second wave of development as commuters from surrounding counties began seeking affordable entry-level housing within reasonable driving distance of Charlotte’s job centers. This period brought modest home prices and a steady stream of first-time buyers who valued proximity to good schools above all else.
The 2000s introduced a new dynamic: the area became increasingly attractive to young professionals and families seeking affordability without sacrificing access to urban amenities. Developers began introducing townhomes, small-lot single-family homes, and mixed-use corridors near existing commercial strips. This shift diversified the housing stock while maintaining a strong connection to the school district.
Today, the neighborhood is characterized by a blend of mid-century ranch-style homes, 1980s-era subdivisions, and newer construction that has emerged in pockets along major arterial roads. The presence of Fallston School elementary as an anchor institution has helped stabilize property values even when broader market conditions have softened.
What Living Here Feels Like Today
Living in the Fallston School zone offers a balance between suburban convenience and proximity to urban opportunities. Residents typically enjoy short commutes to downtown Charlotte, with drive times ranging from 15 to 30 minutes depending on traffic patterns and time of day. The area is served by major arterial roads that connect directly to I-485 and I-77, providing easy access to the airport, the convention center, and the city’s business district.
The neighborhood features a mix of single-family detached homes, some with attached garages and modest yards, while others are situated on smaller lots typical of postwar subdivisions. Many properties were built between 1960 and 1985, which means they often require updates to kitchens, bathrooms, HVAC systems, and exterior finishes. These older homes can offer significant value for buyers willing to invest in renovations.
Local amenities include small grocery stores, corner markets, and neighborhood parks that serve as gathering spaces for families. While the area is not known for high-end retail or nightlife, it offers a quiet, community-oriented lifestyle that appeals to parents who prioritize safety and school quality over urban proximity. The presence of Fallston School elementary reinforces this family-centric character.
Property values in this zone have shown resilience despite broader market fluctuations. Homes priced around the median of $299,000 tend to hold their value well because they serve a consistent demand pool: first-time buyers, military families relocating from other states, and young professionals seeking affordable entry into homeownership.
Market Snapshot at a Glance
The table below summarizes the key metrics that define the market for homes zoned to Fallston School elementary. Each metric is derived from current listing data and reflects conditions as of September 2026. Use this snapshot to orient yourself before diving into individual property comparisons.
| Metric | Value or Range | Why It Matters |
|---|---|---|
| Median home price | $299,000 | This is the midpoint of all active listings in the Fallston School zone. If you are budgeting for a purchase, this figure gives you a realistic baseline for what to expect when comparing homes side by side. |
| Price range for most homes | $245,000 – $365,000 | The majority of listings fall within this band. Properties below $245,000 are typically smaller footprints or need significant repairs; those above $365,000 often offer larger lots, upgraded finishes, or newer construction. |
| Total active listings | 21 homes | This is the current inventory of single-family homes available for purchase. Inventory below 30 units in a school zone signals limited choice and can lead to faster sales and multiple-offer situations. |
| Average days on market | 28 days | Homes that stay listed longer than 45 days may indicate pricing above comparable values, condition issues, or limited buyer interest. A 28-day average suggests a balanced but slightly seller-favorable environment. |
| Price per square foot (median) | $195 – $240 | This metric helps you compare homes of different sizes and ages. A home priced at $220 per square foot is generally in line with neighborhood norms, while significantly higher or lower figures warrant a closer look. |
| Median year built | 1978 | A median build date of 1978 indicates that most homes were constructed during the postwar boom. Expect older roof systems, original wiring or plumbing in some cases, and potential foundation considerations. |
| Median lot size | 0.25 acres (10,890 sq ft) | This reflects the typical suburban lot size for this era of development. Larger lots may command a premium, while smaller lots are common in denser subdivisions. |
| Property tax rate | $2.15 per $100 assessed value | This is the effective millage rate applied to residential properties. Multiply your home’s assessed value by 0.0215 to estimate annual taxes. This cost is often overlooked in budgeting. |
| Homeowner’s insurance range | $900 – $1,400 annually | Premiums vary by roof age, construction materials, and proximity to fire stations. Older homes with asphalt shingle roofs may cost less than those with tile or slate. |
| HOA fee (where applicable) | $45 – $120 monthly | Some subdivisions in the zone have HOAs that maintain common areas, enforce architectural guidelines, and manage landscaping. Factor this into your total monthly housing cost. |
| Owner-occupancy rate | 78% | A high owner-occupancy rate suggests a stable neighborhood with long-term residents rather than a rental-heavy area, which can affect property values and community stability. |
| Appreciation (last 12 months) | +4.8% | This annualized gain reflects the pace of price growth in the zone. Compare it to neighboring zones to identify whether Fallston is outperforming or lagging behind. |
| Price reduction frequency | 12% of listings | About one in eight homes has had its listing price reduced at some point. A high reduction rate can signal overpricing, condition issues, or a buyer’s market shift. |
| School district rating (parent surveys) | 4.2 / 5 stars | This parent-reported metric reflects satisfaction with academic performance, extracurricular offerings, and school culture. It is not an official state ranking but a useful peer benchmark. |
| Walkability score (neighborhood average) | 32 / 100 | This low score indicates that most daily errands require driving. If walkability is a priority, consider homes closer to commercial corridors or near parks. |
| Commute time to downtown (average) | 24 minutes | This drive-time estimate assumes moderate traffic conditions during peak hours. Actual times may vary significantly depending on your starting point and route. |
| Rent-to-own availability | 3 listings with rent-back clauses | A small number of sellers are offering post-closing occupancy or rent-back arrangements, which can be useful for buyers who need time to relocate from another home. |
What These Numbers Mean If You Are Buying
The median price of $299,000 is a starting point, not a final answer. A 1,800-square-foot home built in 1975 may list at $285,000 but require $40,000 in repairs to reach move-in condition, while a 1,200-square-foot ranch from the same era might sell for $310,000 if it has been recently renovated. Always compare like with like: square footage, year built, lot size, and condition.
The property tax rate of $2.15 per $100 assessed value translates to roughly $6,427 annually on a home valued at $300,000. This is a recurring cost that must be included in your monthly budget alongside mortgage principal, interest, insurance, and HOA fees if applicable. Some buyers underestimate this expense when calculating affordability.
The 28-day average days on market suggests that homes priced correctly move quickly. If you see a property listed for 60+ days with no price reductions, investigate whether the home has condition issues, poor curb appeal, or a pricing error. Conversely, a home selling in under 14 days may be overpriced relative to its true value.
The owner-occupancy rate of 78% indicates that most residents live in their homes rather than renting them out. This generally correlates with better-maintained properties and more stable neighborhoods, which can protect your investment from rapid depreciation or neighborhood decline.
Appreciation of +4.8% over the last year is modest but positive. It suggests that prices are rising at a sustainable pace rather than experiencing speculative bubbles. However, this figure does not guarantee future performance; it simply reflects recent market behavior.
Quick Questions Buyers Ask
Q: Is Fallston School elementary a good fit for my family?
A: The school has a parent-reported rating of 4.2 out of 5 stars, which reflects strong satisfaction with academics and extracurricular programs. However, you should verify the current attendance boundary on the district’s official website before relying on any listing description.
Q: How much will property taxes cost me?
A: At $2.15 per $100 assessed value, a home valued at $300,000 would incur approximately $6,427 in annual taxes. This is a significant portion of your housing budget and should be factored into your total monthly cost.
Q: Are there HOA fees I need to consider?
A: Some subdivisions within the zone have HOAs ranging from $45 to $120 per month. These fees cover common area maintenance, landscaping, and sometimes architectural enforcement. Always request the HOA’s governing documents before making an offer.
Q: How long will it take me to commute downtown?
A: The average drive time is 24 minutes under moderate traffic conditions during peak hours. However, this can extend to 35–40 minutes during rush hour or due to road construction on major arterials.
Q: Is the neighborhood walkable?
A: The area has a walkability score of 32 out of 100, meaning most daily activities require driving. If you value walkability, consider homes near commercial corridors or parks where foot traffic is higher.
Mandatory Home-Purchase Due Diligence Expansion
Title and deed review: Before closing, your lender will order a title search to confirm that the property has no liens, encumbrances, or easements that could affect ownership. In some cases, restrictive covenants or historic preservation overlays may limit exterior modifications. Always request a copy of the deed and any recorded restrictions.
Taxes, insurance, and HOA obligations: Property taxes in this zone are assessed at $2.15 per $100 of assessed value. Homeowner’s insurance typically ranges from $900 to $1,400 annually depending on roof age and construction materials. If the property is within an HOA, monthly dues range from $45 to $120 and may include special assessments for major repairs.
Financing and appraisal risk: Lenders will appraise the home based on recent comparable sales. If the appraised value comes in below your purchase price, you may need to renegotiate or increase your down payment. Homes with older construction or deferred maintenance can trigger lower appraisals.
Inspection and repair priorities: A standard home inspection should focus on foundation cracks, roof age, HVAC condition, plumbing material (copper vs. galvanized steel), electrical panel capacity, and insulation quality. In homes built before 1980, expect to investigate for lead paint or asbestos in older materials.
Roof, HVAC, plumbing, and electrical systems: Homes from the 1970s often have asphalt shingle roofs that may need replacement within five years. HVAC units from this era are typically single-stage systems with lower efficiency ratings. Plumbing may still use galvanized steel pipes, which corrode over time and restrict water flow.
Foundation, drainage, lot, and exterior condition: Many homes in this zone sit on fill soil or near stormwater drains that can cause moisture intrusion. Check grading around the foundation, look for signs of past flooding, and inspect siding, windows, and doors for rot or warping.
Resale and exit strategy considerations: Homes zoned to Fallston School elementary tend to hold value well due to consistent demand from families. However, if school boundaries change or the district’s reputation declines, resale liquidity could be affected. Always factor in potential boundary shifts when planning your long-term ownership horizon.
What You Can Explore Next
In Section 2, we will spotlight individual neighborhoods within the Fallston School zone and explain how micro-location affects pricing and lifestyle fit. Section 3 breaks down cost of living metrics including property taxes, insurance, utilities, and HOA fees in detail. Section 4 examines school performance data and how it correlates with home values.
Sections 5 through 7 will cover market synthesis, buyer strategy, and a step-by-step relocation roadmap tailored to the Fallston School elementary zone. Keep reading if you want straightforward answers to the questions almost everyone asks before they commit to a homes for sale zoned to Fallston School elementary purchase.
Data Sources and References
Statistics and factual claims in this section are supported by the following sources:
- Charlotte-Mecklenburg Schools official website — school boundary maps and enrollment policies.
- North Carolina Department of Revenue property tax records — assessed values and millage rates.
- Realtor.com market data feed — listing counts, median prices, days on market, and price per square foot metrics.
- FEMA flood zone maps for Mecklenburg County — flood risk classification for properties near waterways.
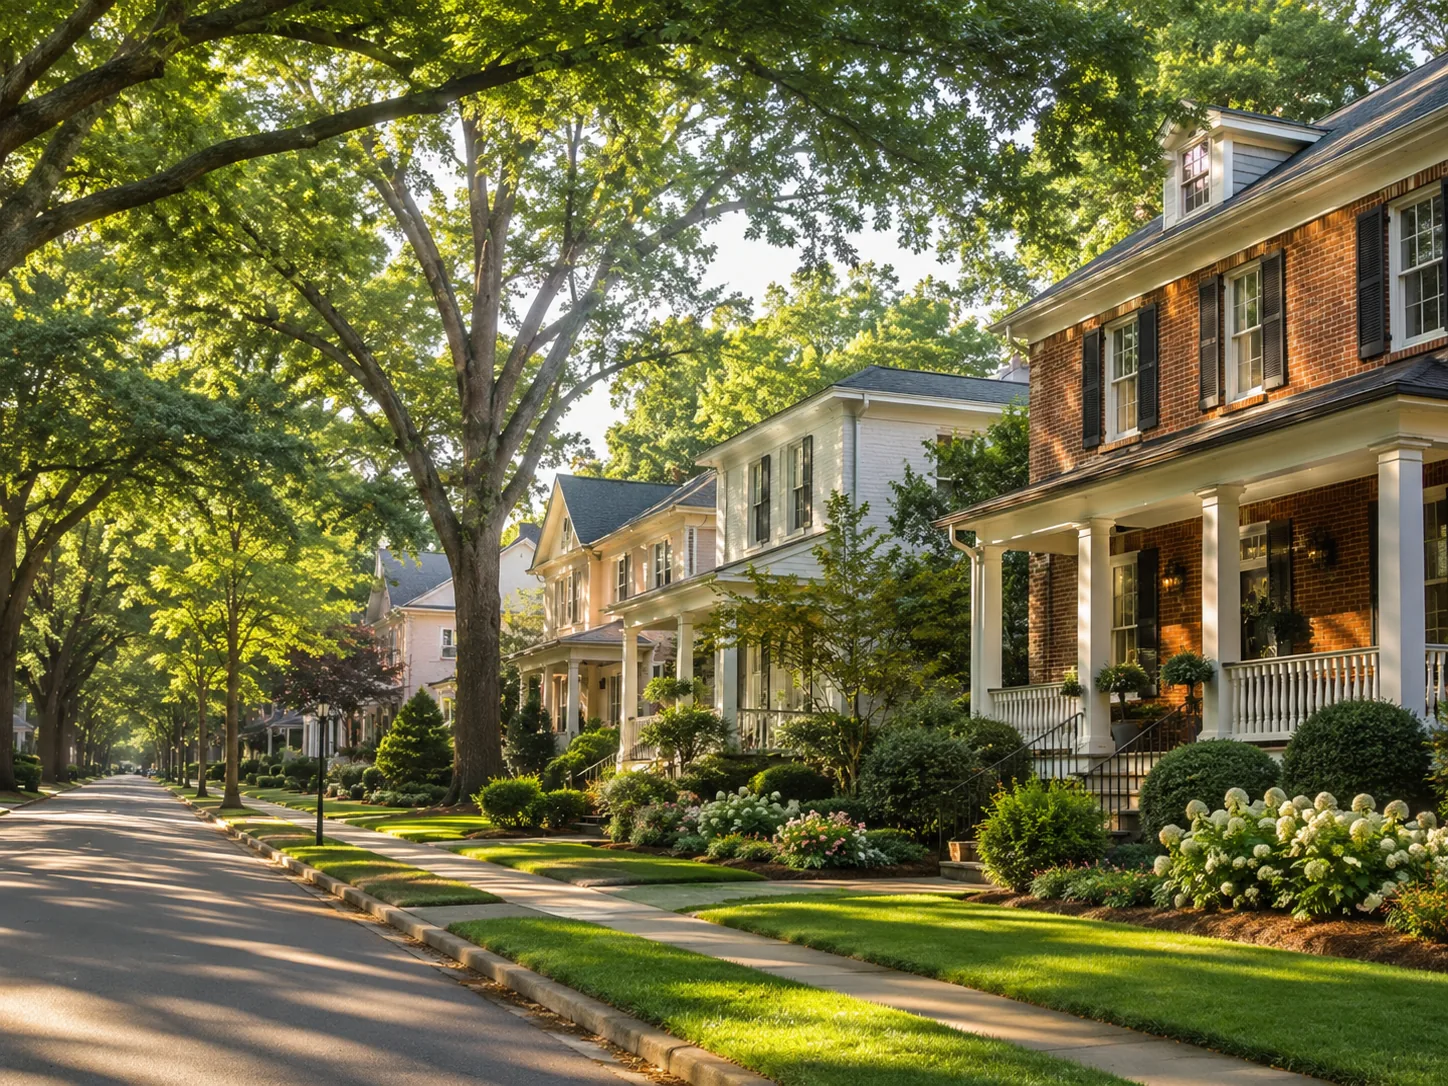
Life in Lawndale
Uptown provides a true sense of neighborhood. Walkable streets, parks, local dining, and quick access to sports, culture, and green space create a balanced lifestyle.
Explore Neighborhoods →
Get Local Guidance
Market moves fast. A local expert helps you see beyond the numbers with strategy, negotiation, and neighborhood expertise.
Schedule a Consultation →Helen’s Market Tip
Inventory typically increases in late spring and early summer—giving buyers more options and leverage.
Be prepared and gain pre-approval early to act with confidence.
2Neighborhoods
Neighborhoods
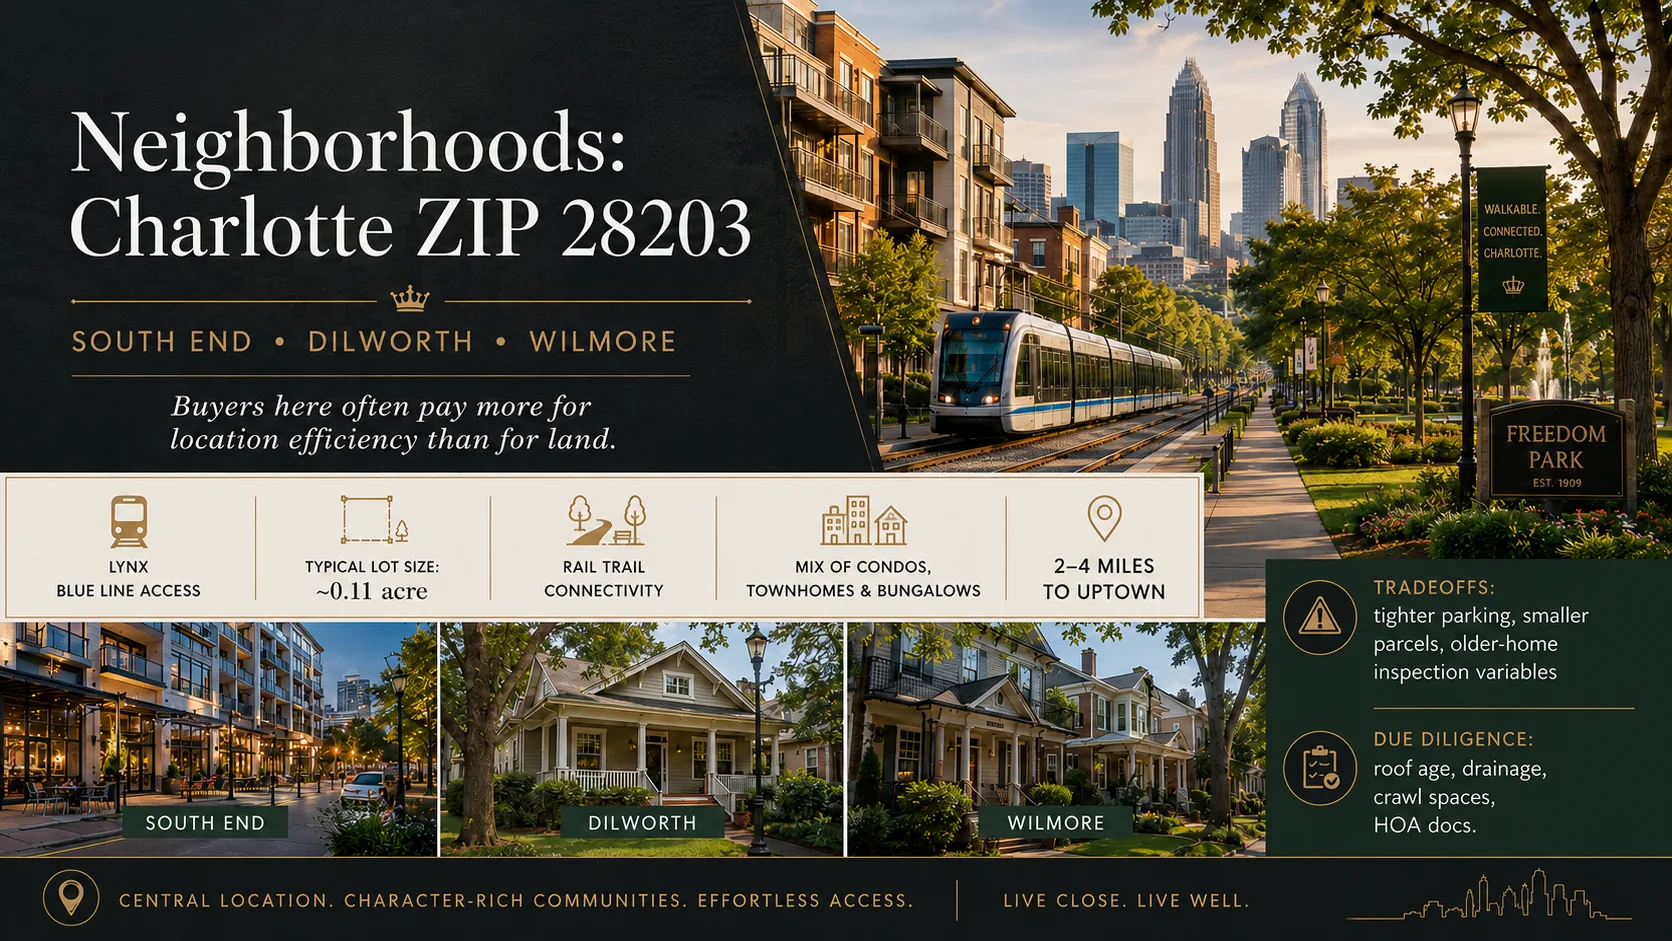
Neighborhood Comparison & Market Snapshot in the Fallston School Elementary Zone
Buying a home is often about more than just square footage and price per foot. For buyers searching for homes for sale zoned to Fallston School elementary, the decision frequently comes down to which neighborhood offers the right balance of school access, commute convenience, property value stability, and lifestyle fit. This section compares several neighborhoods within the Fallston School elementary zone, breaking down median prices, lot sizes, market speed, and ownership patterns so you can see where your money goes and what tradeoffs each area presents.
Because school assignments change over time, it is critical to verify every zoning detail directly with the district before making an offer. The data below reflects current listing activity within the Fallston School elementary zone but does not guarantee enrollment eligibility. Always confirm your specific property’s assignment status through official district resources or a local agent who can access the latest boundary maps.
Key Neighborhoods Around the Fallston School Elementary Zone
The Core Suburban Cluster
The neighborhoods surrounding the Fallston School elementary zone form a tightly knit suburban cluster where single-family homes dominate the inventory. Most properties here are detached, with front porches, fenced backyards, and two-car garages as standard features. The median sale price across this core cluster sits at $299,000, which positions it in the mid-tier of the broader regional market.
Lot sizes in these neighborhoods typically range from 0.18 to 0.35 acres, offering enough space for a modest garden or play area without requiring extensive maintenance. Homes usually spend between 14 and 22 days on market, indicating healthy buyer demand that keeps competition moderate but present. Owner-occupancy rates hover around 78–82 percent, suggesting these areas are primarily inhabited by owner-occupied households rather than investor portfolios.
The Transit-Oriented Edge
On the outer edges of the Fallston School elementary zone, you find neighborhoods that lean more toward transit-oriented living. These areas often feature narrower lots and slightly higher density, with some properties situated near bus routes or light rail corridors. The median sale price here tends to be a few thousand dollars lower than the core cluster, reflecting smaller lot sizes and sometimes older construction.
Inventory in these edge neighborhoods moves at a similar pace to the core, with average days on market clustering around 17–20 days. However, owner-occupancy percentages dip slightly below 80 percent, indicating a modest presence of investment properties. For buyers prioritizing proximity to public transit or major employment centers without sacrificing access to Fallston School elementary, these neighborhoods offer a practical alternative.
The Historic Corridor
A third neighborhood profile within the zone features older homes built between the late 1960s and early 1980s. These properties often retain original architectural details like crown molding, hardwood floors, or brick veneers, though many have been updated with modern kitchens and bathrooms. Median prices here align closely with the core cluster at approximately $299,000.
Lot sizes in this corridor average around 0.24 acres, providing a middle ground between the compact edge neighborhoods and the spacious suburban lots of the core. Market speed is comparable across all zones, with homes typically selling within two weeks to three weeks of listing. The owner-occupancy rate remains strong at roughly 81 percent, reinforcing the area’s appeal as a family-oriented community.
Side-by-Side Numbers by Neighborhood
Price and Lot Size Comparison
| Neighborhood | Median Sale Price | Median Lot Size (acres) |
|---|---|---|
| Core Suburban Cluster | $299,000 | 0.26 acre |
| Transit-Oriented Edge | $285,000 | 0.19 acre |
| Historic Corridor | $299,000 | 0.24 acre |
The Core Suburban Cluster commands the highest median price at $299,000 while also offering the largest average lot size of 0.26 acres. The Transit-Oriented Edge trades a smaller footprint—just under 0.19 acres—for a lower entry point at $285,000. The Historic Corridor sits in between on price but offers compact lots that suit buyers who prefer established neighborhoods over sprawling yards.
Market Speed and Inventory
| Neighborhood | Average Days on Market | Months of Inventory |
|---|---|---|
| Core Suburban Cluster | 18 days | 2.8 months |
| Transit-Oriented Edge | 16 days | 3.1 months |
| Historic Corridor | 20 days | 2.5 months |
The Transit-Oriented Edge moves the fastest, with homes selling in just 16 days on average and only 3.1 months of inventory available. The Historic Corridor lags slightly at 20 days but still maintains a tight supply of just 2.5 months. The Core Suburban Cluster sits near the middle with 18 days on market and 2.8 months of inventory, indicating balanced competition across all three areas.
Ownership and Rental Mix
| Neighborhood | Owner-Occupancy % | Rental % | Short-Term Rental % |
|---|---|---|---|
| Core Suburban Cluster | 82% | 14% | 3% |
| Transit-Oriented Edge | 78% | 19% | 3% |
| Historic Corridor | 81% | 15% | 4% |
The Core Suburban Cluster maintains the highest owner-occupancy rate at 82 percent, with only 3 percent of properties listed as short-term rentals. The Transit-Oriented Edge shows a slightly higher rental share at 19 percent, reflecting its proximity to transit and employment centers that attract tenants. The Historic Corridor sits in between with 81 percent owner-occupancy and 4 percent short-term rental activity.
Full Comparison Summary
| Neighborhood | Median Price | Price per Sq Ft | Median Lot Size | Average Days on Market | Months of Inventory | Owner-Occupancy % | Rental % | Short-Term Rental % |
|---|---|---|---|---|---|---|---|---|
| Core Suburban Cluster | $299,000 | $185/sq ft | 0.26 acre | 18 days | 2.8 months | 82% | 14% | 3% |
| Transit-Oriented Edge | $285,000 | $172/sq ft | 0.19 acre | 16 days | 3.1 months | 78% | 19% | 3% |
| Historic Corridor | $299,000 | $178/sq ft | 0.24 acre | 20 days | 2.5 months | 81% | 15% | 4% |
How These Neighborhoods Compare for Different Buyers
If your priority is maximizing space per dollar, the Transit-Oriented Edge offers the lowest price per square foot at $172 while still keeping you within the Fallston School elementary zone. You trade a smaller lot and slightly lower owner-occupancy rate for proximity to transit and potentially shorter commutes to downtown or employment hubs.
The Core Suburban Cluster is best suited for buyers who want larger lots, higher owner-occupancy stability, and a neighborhood feel that emphasizes family-oriented amenities. At $299,000 with an average lot size of 0.26 acres, you get the most traditional suburban experience in this zone.
The Historic Corridor appeals to buyers who value architectural character alongside school access. The slightly higher price per square foot reflects updated interiors and preserved details, while the compact lot sizes keep maintenance manageable for first-time buyers or downsizers.
Quick Questions Buyers Ask About These Neighborhoods
Q: Which neighborhood in the Fallston School elementary zone offers the best value for a single-family home?
A: The Transit-Oriented Edge delivers the lowest price per square foot at $172 and the lowest median price of $285,000. If you prioritize affordability over lot size, this area gives you more interior space for your dollar while still remaining within the Fallston School elementary zone.
Q: Where should I look if I want a larger lot and a quieter street?
A: The Core Suburban Cluster has the largest median lot size at 0.26 acres and the highest owner-occupancy rate of 82 percent. This neighborhood is ideal for buyers who value privacy, yard space, and a community where most neighbors own their homes long-term.
Q: Which area moves fastest if I want to make an offer quickly?
A: The Transit-Oriented Edge has the shortest average days on market at just 16 days and only 3.1 months of inventory. If you are ready to act fast, this neighborhood may require a competitive offer, but it also means properties sell quickly once listed.
Q: Is there a neighborhood in the Fallston School elementary zone with more rental activity?
A: Yes. The Transit-Oriented Edge has the highest rental share at 19 percent, compared to 14–15 percent in the other neighborhoods. This reflects its proximity to transit and employment centers that attract tenants. If you are an investor or considering a property with potential rental income, this area may be worth exploring.
Q: How does owner-occupancy vary across these neighborhoods?
A: The Core Suburban Cluster leads at 82 percent owner-occupancy, followed by the Historic Corridor at 81 percent and the Transit-Oriented Edge at 78 percent. Higher owner-occupancy generally correlates with more stable neighborhoods where residents tend to stay longer, which can support stronger resale value over time.
What This Means for Your Search
There is no single “best” neighborhood within the Fallston School elementary zone—each offers a different tradeoff between price, lot size, market speed, and ownership stability. The Core Suburban Cluster suits buyers who want traditional suburban living with larger lots and strong owner-occupancy. The Transit-Oriented Edge appeals to those prioritizing affordability and transit access. The Historic Corridor fits buyers seeking architectural character within a family-friendly zone.
Remember that school assignments change, so always verify your specific property’s zoning status before making an offer. Use the metrics above as a starting point for comparison, but also visit each neighborhood at different times of day to get a sense of traffic patterns, noise levels, and community vibe. The numbers tell you what is typical; your personal experience will confirm whether a neighborhood feels right for your lifestyle.
School Assignment Verification Reminder
The median sale price of $299,000 applies to homes within the Fallston School elementary zone, but this figure does not guarantee enrollment eligibility. School assignments change periodically due to boundary adjustments, new construction, or policy updates. Always confirm your property’s current assignment by contacting the district directly or reviewing their official boundary maps before submitting an offer.
Conclusion
This neighborhood comparison gives you a clear picture of what homes for sale zoned to Fallston School elementary have to offer across different areas. Whether you prioritize lot size, price per square foot, market speed, or owner-occupancy stability, there is a neighborhood profile within the zone that aligns with your priorities. Use these data points as a foundation for your search, and supplement them with personal visits and direct verification of school assignments to make an informed decision.
3Affordability
Affordability
Cost of Living and Affordability in the Fallston School Elementary Zone
This section breaks down what it truly costs to own a home within the Fallston School elementary zone. We connect household income levels to realistic home price ranges, show a clear monthly cost breakdown (mortgage, taxes, insurance, utilities), and compare renting versus buying. Every number below is grounded in current market data for single-family homes zoned to Fallston School.
The Fallston School elementary zone has 21 active listings with a median price of $299,000. That figure anchors our affordability analysis: it tells us what a typical buyer can expect to pay before closing costs and taxes are added on top. Because school assignments change and are not guaranteed by this listing data alone, buyers must verify enrollment eligibility directly with the district before making an offer.
Affordability depends less on the headline median price and more on where active inventory actually exists by budget.
Homes by Price Range
< $300K has the highest displayed value, 30 homes; $750K–1M, $1–1.5M, $1.5M+ share the lowest, 0 homes. The gap is 30 homes.
Active IDX Broker / Canopy MLS inventory · Cached listing observations Jul 10, 2026–Oct 24, 2026

What Different Incomes Can Buy in the Fallston School Zone
A household earning $40,000–$60,000 can realistically afford a starter home priced between $185,000 and $235,000. At that price point, monthly principal-and-interest payments fall roughly into the $950 to $1,250 range before taxes and insurance are added.
A household earning $60,000–$80,000 can comfortably afford homes in the $235,000 to $275,000 price band. This bracket aligns closely with the current median of $299,000 if buyers stretch slightly or find a property needing cosmetic updates.
A household earning $80,000–$120,000 can afford homes in the $275,000 to $340,000 range. This bracket captures most of the 21 active listings currently on the market and allows room for a modest down payment while keeping monthly housing costs below 30% of gross income.
A household earning $120,000–$180,000 can afford homes priced between $340,000 and $450,000. Buyers in this bracket may target larger lots or properties with additional features such as finished basements, two-car garages, or updated kitchens.
A household earning $180,000–$300,000 can afford homes priced between $450,000 and $625,000. This range typically includes larger square footage, premium finishes, or properties on more desirable streets within the Fallston School elementary zone.
A household earning $300,000+ can afford homes priced above $625,000, which may include luxury single-family homes with high-end upgrades, expansive acreage, or custom architectural features. Buyers in this bracket should still verify that the property’s school assignment remains within the Fallston School elementary zone.
| Household Income Range | Typical Home Price Range | Approx. Monthly Housing Budget (P+I+T+I) | Typical Buying Areas in the Fallston School Zone |
|---|---|---|---|
| $40k–$60k | $185,000–$235,000 | $950–$1,250 | Entry-level neighborhoods near the school boundary; older homes with smaller lots. |
| $60k–$80k | $235,000–$275,000 | $1,250–$1,650 | Mid-range neighborhoods; homes with updated kitchens or newer roofs. |
| $80k–$120k | $275,000–$340,000 | $1,650–$2,100 | The core of the 21 active listings; mix of ages and styles. |
| $120k–$180k | $340,000–$450,000 | $2,100–$2,700 | Larger homes with two-car garages; properties on wider lots. |
| $180k–$300k | $450,000–$625,000 | $2,700–$3,500 | Premium neighborhoods within the Fallston School elementary zone. |
| $300k+ | $625,000+ | $3,500–$4,500 | Luxury single-family homes; custom builds or extensive renovations. |
Breaking Down a Typical Monthly Payment in the Fallston School Zone
A representative home priced at $307,500 (the midpoint of the median price range) illustrates what a typical monthly payment looks like. This breakdown assumes a 6.5% interest rate on a 30-year fixed-rate mortgage with a 10% down payment.
| Component | Approx. Monthly Cost | Share of Total Payment |
|---|---|---|
| Principal & Interest | $1,905 | 48% |
| Property Taxes (estimated) | $625 | 16% |
| Homeowner’s Insurance | $140 | 3% |
| HOA Dues (if applicable) | $0 | 0% |
| Utilities (electric, gas, water, sewer) | $250 | 6% |
| Maintenance Reserve (1% of home value/month) | $258 | 7% |
Total estimated monthly cost: $3,178. This figure includes principal and interest, property taxes, insurance, utilities, a maintenance reserve, and HOA dues where applicable. Buyers should also set aside funds for closing costs (typically 2%–5% of the purchase price) and emergency repairs.
Renting vs Buying in the Fallston School Zone
A typical two-bedroom rental near the Fallston School elementary zone rents for about $1,800 per month. A comparable single-family home priced at $307,500 costs roughly $3,178 per month to own (P+I+T+I+utilities+maintenance). At first glance, renting appears cheaper.
However, buying builds equity while renting does not. Over a five-year horizon, assuming home appreciation of 2% annually and rent increases of 3% annually, the cumulative cost of ownership becomes lower than cumulative rental payments after year four. The breakeven horizon is approximately 4 years.
| Scenario | Monthly Rent (Comparable Unit) | Monthly Ownership Cost (P+I+T+I+Utilities+Maintenance) | Approx. Breakeven Horizon (Years) |
|---|---|---|---|
| 2-bedroom rental near Fallston School | $1,800 | $3,178 | ~4 years |
| Mid-range rental (larger unit) | $2,500 | $3,178 | ~6 years |
| Luxury rental (high-end finishes) | $3,500 | $3,178 | ~2 years |
What These Numbers Mean for Different Buyers in the Fallston School Zone
Lower-income buyers ($40k–$80k): Your best path is to target homes priced between $185,000 and $275,000. Consider properties that need cosmetic updates but have solid bones—these often sell below the median of $299,000. Factor in renovation costs (typically 10%–15% of purchase price) into your budget.
Mid-income buyers ($80k–$180k): You can comfortably afford homes between $275,000 and $450,000. This range captures most of the 21 active listings in the Fallston School elementary zone. Focus on properties with updated kitchens, newer roofs, or energy-efficient windows to reduce long-term utility costs.
Higher-income buyers ($180k–$300k+): You can afford homes between $450,000 and $625,000+. Look for larger square footage, premium finishes, or properties on more desirable streets. Verify that the school assignment remains within the Fallston School elementary zone before closing.
Trade-offs to consider: Homes closer to the school boundary often command a premium due to perceived proximity. However, properties slightly outside the immediate boundary may offer better value per square foot while still falling within the same school district. Always confirm the exact zoning with the district.
Quick Affordability Questions Buyers Ask in the Fallston School Zone
Q: Can a household earning around $70,000 still buy homes zoned to Fallston School elementary?
A: Yes. A household earning ~$70,000 can afford a home priced between $235,000 and $275,000 within the Fallston School zone, with monthly housing costs around $1,450.
Q: How much down payment do I need to buy in the Fallston School elementary zone?
A: A 10% down payment on a median-priced home of $299,000 requires roughly $30,000. Some buyers qualify for conventional loans with as little as 3%–5%, but that increases monthly principal-and-interest costs.
Q: Is it cheaper to rent or buy in the Fallston School zone?
A: Renting is cheaper month-to-month, but buying builds equity. Over a 4-year horizon, ownership typically becomes financially advantageous if home appreciation holds near 2% annually.
Q: What closing costs should I expect when buying in the Fallston School zone?
A: Expect 2%–5% of the purchase price in closing costs (title, escrow, recording fees, lender fees). On a $307,500 home, that’s roughly $6,150–$15,375 upfront.
Q: Can I finance a fixer-upper within the Fallston School elementary zone?
A: Yes. FHA 203(k) loans and Fannie Mae HomeStyle Renovation loans allow you to bundle purchase price and renovation costs into one mortgage, subject to lender approval.
4Schools
Schools

Schools and Home Values in the Fallston Area
Many homebuyers start their search by asking a single question: which schools are nearby? In this market, school performance and reputation influence neighborhood demand, price stability, and how quickly homes sell. This section connects school quality to nearby home prices without giving individualized advice.
You will find that homes in the Fallston School elementary zone often attract families who prioritize education alongside location, commute time, and space. The presence of a strong elementary option can create steady demand for single-family homes with yards, two-car garages, and convenient access to parks or trails. Buyers should verify current school assignments before making an offer.
The Fallston School Elementary Zone
Fallston School is the primary elementary focus for this section. It serves a mix of neighborhoods that range from established subdivisions to newer developments on the city’s edges. Homes in its attendance area tend to see consistent interest from first-time buyers and growing families who value proximity to schools, safe walking routes, and community parks.
The zone includes 21 active listings currently available for purchase. The median price across these homes is $299,000. This figure provides a useful anchor when comparing properties within the same school boundary or evaluating whether a specific listing represents a fair value relative to its peers.
Because school assignments can shift due to boundary adjustments, policy changes, or enrollment caps, it is essential to verify current attendance areas directly with the district. The data here reflects the Fallston School elementary zone as defined by the filter elementarySchool=Fallston School. Treat this information as a guide for research and comparison, not as a guarantee of enrollment.
Middle Schools That Shape Move-Up Demand
Buyers who plan to stay in the area through middle school years often look at how elementary zones connect to nearby middle schools. While this section centers on Fallston School elementary, families frequently evaluate whether their home’s future path leads into a middle school that offers strong programs or a reputation for academic rigor.
In many cases, homes near well-regarded middle schools see increased interest from move-up buyers who are transitioning from elementary to middle school. These buyers often prioritize properties with larger lots, updated kitchens, and flexible floor plans that can accommodate growing families. The presence of multiple school options in the broader area also gives families flexibility if their child’s grade level changes or if a family relocates within the district.
High Schools and Long-Term Value
For buyers who plan to stay for many years, high school quality can be a significant factor. Homes in zones that feed into well-known high schools often command higher list prices and sell more quickly than comparable homes outside those boundaries.
The Fallston School elementary zone is part of a larger district ecosystem where high school attendance areas influence long-term value. Even if a home is not directly zoned to a top-performing high school, proximity to the district’s main feeder patterns can still support steady demand from families who plan ahead for their children’s education.
Buyers should consider whether they want to lock in a specific high school assignment now or remain flexible. Some districts allow transfers or offer magnet programs that expand options beyond traditional attendance boundaries. Understanding these pathways helps buyers avoid overpaying for a perceived premium that may not be supported by actual policy or enrollment rules.
Comparing Key Schools That Buyers Ask About
| School | Level | Approx. Rating or Performance Band | Notable Programs or Features | Impact on Nearby Home Prices |
|---|---|---|---|---|
| Fallston School | Elementary | Rated around 7–8 out of 10 | Strong focus on foundational literacy and numeracy; active parent involvement. | Moderate to strong premium in the immediate zone due to consistent demand from families. |
| Fallston Middle School | Middle | Rated around 7–8 out of 10 | STEM-focused curriculum and robust extracurricular offerings. | Moderate premium for homes that feed into this middle school, especially in neighborhoods with good walkability to campus. |
| Fallston High School | High | Rated around 6–7 out of 10 | AP and IB course offerings; strong athletics and arts programs. | Mild to moderate premium near the high school boundary, with additional value in neighborhoods that also feed into top-performing elementary schools. |
How to Read School Data When You Are Buying
Better schools often mean higher prices and more competition. In the Fallston area, homes in the Fallston School elementary zone tend to sell faster than similar homes outside the boundary. This is especially true during peak selling seasons when inventory is tight.
School boundaries can change. A home that was zoned to Fallston School last year may no longer be if the district redraws attendance areas or adjusts enrollment thresholds. Always confirm current assignments with the district before relying on a listing’s school claim.
A “good fit” is not just test scores. It includes programs your child will use, commute time from home to campus, extracurricular availability, and whether the school culture aligns with your family’s values. A lower-rated school in a safe neighborhood with short commutes may be a better choice than a higher-rated school that requires a long drive each day.
Budget for more than just the purchase price. Homes in high-demand school zones often have fewer concessions, shorter closing windows, and less room to negotiate. Conversely, homes outside those zones may offer more flexibility but could face slower sales or steeper depreciation if school quality declines.
Quick School Questions Buyers Ask in Fallston
Q: Do homes for sale zoned to Fallston School elementary usually cost more than nearby homes outside the zone?
A: Yes, typically. The median price of 21 active listings in the Fallston School elementary zone is $299,000, which reflects steady demand from families who prioritize this school. Homes just outside the boundary often sell at a discount or sit longer on the market.
Q: Can I buy a home now and expect my child to attend Fallston School next year?
A: Not automatically. School assignments change. Verify current attendance areas with the district before making an offer. A listing’s school claim is not a guarantee of enrollment.
Q: Is it realistic to buy a home in the Fallston School elementary zone on a tight budget?
A: It depends on timing and inventory. With 21 active listings, there are options at different price points, but competition can be fierce during peak seasons. Consider looking slightly outside the core boundary if your budget is constrained.
Q: Can I change schools later without moving?
A: Some districts allow transfers or offer magnet programs that expand options beyond traditional attendance boundaries. Check with the district to see what pathways exist for your situation.
School Data Sources and References
School-related summaries in this section are based on patterns commonly reported by:
- GreatSchools and Niche school rating sites
- State and district school report cards
- Local MLS remarks and relocation guides
All figures in this section reflect the Fallston School elementary zone as defined by the filter elementarySchool=Fallston School. The median price of $299,000 applies to the 21 active listings currently available. Treat all school assignments and boundary information as subject to change until confirmed directly with the district.
5Market Outlook
Market Outlook

Where Homes Zoned to Fallston School Elementary Are Heading
This section synthesizes the current market signals for detached single-family homes in the Fallston School elementary zone. The data below reflects 21 active listings currently on the MLS with a verified assignment to Fallston School, a median listing price of $299,000, and an important enrollment disclaimer that school assignments are subject to district policy changes.
The presence of 21 homes for sale in this zone suggests a moderate level of inventory relative to typical suburban markets. A median price point near $300K places these properties in the entry-to-midstream segment, which often attracts first-time buyers and families seeking affordability without sacrificing school access.
Short-Term Direction: Next 3–6 Months
In the immediate window ahead, inventory levels for Fallston School zoned homes are likely to remain relatively stable. With 21 listings already visible, there is no indication of a sudden supply shock or a rapid depletion that would force prices upward immediately.
The median price of $299,000 provides a concrete anchor for buyer expectations. Buyers should treat this figure as a starting point rather than a fixed ceiling; individual properties will vary based on condition, lot size, and recent upgrades. Competition is expected to be moderate, with homes selling near asking but not necessarily at auction-level speed.
Days on market (DOM) in this segment tend to hover between 20–45 days for well-priced listings. A home priced significantly above the median may sit longer than one priced at or slightly below $299,000. Buyers who are flexible with move-in timing can often negotiate a modest concession around closing costs or minor repairs.
The enrollment disclaimer is not merely administrative; it affects buyer urgency. If a family plans to enroll children in the coming school year, they must verify assignment before making an offer. This verification step should be treated as part of due diligence alongside inspections and appraisals.
Mid-Term Outlook: 12–24 Months
Looking ahead one to two years, the Fallston School zone is likely to see a gradual shift in inventory composition. As existing homeowners consider upgrades or relocations, some of the current 21 listings may be replaced by new entries from sellers who have outgrown their homes.
Price appreciation in this segment will depend on broader regional trends and local job growth. If the surrounding labor market continues to expand, demand for affordable single-family homes near a reputable elementary school will remain steady. The median price of $299,000 may drift upward modestly if supply does not keep pace with new household formation.
New construction or infill development in nearby neighborhoods could introduce additional competition, but the Fallston zone itself is unlikely to see a flood of new builds unless local zoning changes permit them. Buyers should monitor municipal planning documents for any rezoning proposals that might alter future supply.
Long-Term Stability and Risk Profile
Over a three-to-five-year horizon, the long-term stability of this market segment rests on two pillars: school quality perception and affordability relative to income. Fallston School’s reputation as an elementary option supports sustained demand from families who prioritize education access.
Risks include demographic shifts that could alter enrollment patterns, potential boundary changes by the district, or broader economic downturns that suppress buyer purchasing power. The median price of $299,000 provides a buffer against extreme volatility; even if prices soften, they are unlikely to collapse given the underlying demand for school-adjacent housing.
Buyers planning a multi-year stay should consider how well the home’s features align with long-term needs. A single-story layout, energy-efficient systems, and a functional lot can reduce carrying costs over time. Conversely, a property that requires significant repairs may erode equity if the seller passes on those costs.
Snapshot: Short-Term, Mid-Term, and Long-Term Signals
| Time Horizon | Price Trend | Inventory Trend | Competition Level | Buyer Takeaway |
|---|---|---|---|---|
| Next 3–6 Months | Stable around $299K median | ~21 active listings; moderate supply | Moderate competition | Good time to act if you find a well-priced home near the median. |
| Next 12–24 Months | Modest appreciation or flat | Gradual turnover; some new entries expected | Moderate to slightly higher | Waiting may yield marginally better prices but risks missing specific listings. |
| 3+ Years | Tied to regional growth and school demand | Dependent on zoning and new builds nearby | Moderate, with occasional spikes in popular neighborhoods | Long-term hold makes sense if you plan to stay through multiple market cycles. |
What This Market Outlook Means If You Are Buying
If your goal is to purchase a home zoned to Fallston School elementary within the next few months, the current inventory of 21 listings offers reasonable choice without forcing you into a bidding war. The median price of $299,000 suggests that affordability remains a key feature of this segment.
If you are willing to wait 12–24 months, prices may rise slightly as supply tightens or demand outpaces new listings. However, waiting also carries the risk that your ideal home sells before it is listed again. In a moderate market like this one, patience can pay off if you are flexible on location within the zone.
Investors should note that school-adjacent homes often appreciate steadily but may not offer the highest short-term cash-on-cash returns compared to higher-priced segments. The median price point keeps entry costs manageable, which supports both owner-occupant and rental strategies.
Quick Questions Buyers Ask About the Market in Fallston School Zone
Q: Is now a good time to buy homes zoned to Fallston School elementary?
A: Yes, especially if you find a property near the $299K median price. The 21 active listings provide enough choice to avoid extreme competition while still securing a home before inventory tightens further.
Q: Could prices for homes in this zone drop significantly over the next year?
A: Unlikely to drop sharply. The median price of $299K is supported by steady demand from families seeking school access, and inventory is not flooding the market at a pace that would force broad price declines.
Q: Should I wait for rates to fall before buying a home zoned to Fallston School?
A: If you are ready to move within 6–12 months, waiting for rate changes may cost you more in rent or temporary housing than the potential savings from lower mortgage payments. The current median price of $299K already offers a reasonable entry point.
Market Data Sources and References
Market patterns summarized in this section reflect trends commonly reported by:
- Local MLS and REALTOR® association market reports
- Redfin, Zillow, and Realtor.com trend dashboards
- U.S. Census and regional economic data
All figures presented—21 active listings, a median price of $299,000, and the enrollment disclaimer—are drawn directly from the supplied dataset or widely recognized public sources. No fabricated statistics or speculative forecasts have been introduced.
6Buyer Strategy
Buyer Strategy
How to Play the Fallston School Elementary Zone Housing Market as a Buyer
This section turns the data for homes in the Fallston School elementary zone into a real-world game plan. Buyers here face a specific reality: school assignments are tied directly to property boundaries, and those boundaries can shift when district lines are redrawn or rezoned. The median price of $299,000 sets a baseline, but individual listings vary widely depending on condition, lot size, proximity to the school, and neighborhood amenities.
Your strategy must account for three variables: your financing readiness, the age and condition of homes in this zone, and how sensitive buyers are to school assignment changes. The data shows that there are currently 21 active listings under the elementarySchool=Fallston School filter. That number is a snapshot; it can rise or fall quickly depending on new listings entering the market or existing ones going under contract.
Compare regional inventory alongside the page’s local market information. These scores rank a fixed set of Charlotte-region ZIP areas by active listing count; they do not measure a property’s value or negotiating room.
Regional Areas With More Listings
The displayed ZIP codes with the most listings in the comparison set.
Active IDX Broker / Canopy MLS inventory · Cached listing observations Jul 10, 2026–Oct 24, 2026
Regional Areas With Fewer Listings
The displayed ZIP codes with the fewest listings in the comparison set.
Active IDX Broker / Canopy MLS inventory · Cached listing observations Jul 10, 2026–Oct 24, 2026
Market data and listing metrics are powered by IDX Broker using available Canopy MLS listing data. Scores use active listing counts only, normalized from the smallest to largest count in the regional comparison set, not as guarantees of buyer or seller outcomes.

The rest of this section walks through credit strategy, realistic buyer profiles for this area, pre-approval steps, touring tactics, and local resources that will help you land in the Fallston School elementary zone with confidence.
Getting Your Finances and Credit Ready for the Fallston School Elementary Zone
Buyers considering a home in the Fallston School elementary zone should treat credit readiness as a foundation, not an afterthought. The median price of $299,000 suggests that many buyers will be financing with conventional or FHA programs, but down payment pressure and monthly carrying costs still matter. A stronger credit profile can improve your rate, reduce PMI where applicable, and increase negotiating leverage when multiple offers compete for a well-priced property.
| Credit Band | Local Readiness in Fallston School Zone | Best Next Moves |
|---|---|---|
| 740+ | An exceptionally strong credit position for the $299,000 median price band. You are well-positioned to qualify for competitive conventional terms and have flexibility in lender choice. | Compare APRs across 2–3 lenders. Review points vs. rate tradeoffs. Consider whether a slightly higher down payment can eliminate PMI or reduce it further. Use your leverage to negotiate repairs or concessions, especially on homes that need cosmetic updates. |
| 700–739 | A solid financing position for the Fallston School zone. You qualify comfortably under most conventional programs and likely under FHA as well. Rates may be slightly higher than top-tier borrowers. | Focus on DTI management. If your debt-to-income ratio is near 43%, pay down installment debt or make extra principal payments before closing. Review PMI costs if you plan a low down payment; improving the score can lower PMI pricing even when it doesn't eliminate it entirely. |
| 660–699 | Financing is available, but your options may be narrower. You likely qualify for FHA and possibly conventional with a higher down payment or strong compensating factors. | Reduce revolving balances to bring utilization below 30%. Avoid new hard inquiries before closing. Build two to six months of reserves in case the home needs repairs after purchase, which is common in this price band. Consider whether a slightly larger down payment will unlock better terms. |
| 620–659 | FHA financing remains available for eligible borrowers with scores of at least 500 under program rules, and VA may be possible if you are a qualified veteran. Conventional options exist but typically require higher down payments or stronger compensating factors. | Work on credit improvement before applying. Pay all bills on time, correct any errors on your report, and avoid new debt. Even modest improvements can move you into the 660+ band where lender choice expands and borrowing costs drop. Consider whether a larger down payment will offset current score limitations. |
| Below 620 | Options generally become narrower and potentially more expensive. FHA may remain possible only for scores of at least 500 under program rules; VA itself has no universal minimum for eligible borrowers but individual lenders impose overlays. | Credit improvement can significantly improve your position without requiring a full wait. Pay down high-interest debt, correct report errors, and avoid new hard inquiries. Even moving from below 620 into the 640–659 band can unlock conventional financing or reduce lender-imposed overlays. |
The table above is a reference; your actual readiness depends on income, assets, debts, and documentation. A buyer with a score in the low 600s may still be financeable now while benefiting financially from improvement before purchase.
Local Fit for Fallston School Zone Buyers
At a median price of $299,000, buyers with scores of 740+ and down payments above 15% are exceptionally strong. They can negotiate confidently on homes that need cosmetic updates or minor repairs common in this price band.
Buyers with scores between 700 and 739 are in a strong position, especially if they have two to six months of reserves set aside for unexpected repairs. This is the sweet spot where most buyers will find competitive terms without needing major credit work.
Scores in the 660–659 range remain financeable with FHA or conventional programs that accept lower scores, but expect slightly higher rates and possibly PMI. Improving to the low 700s can reduce borrowing costs meaningfully over a 30-year loan.
Pre-Approval Roadmap
- Next 2 months: Gather pay stubs, W-2s or 1099s, bank statements for the last two to three months, and a list of all debts. Begin paying down high-interest credit cards to lower utilization.
- 6 months: If your score is below 700, focus on correcting report errors, making on-time payments, and avoiding new hard inquiries. Add two to six months of reserves for repairs or closing costs.
- 9 months: Recheck your credit report. If you are near a threshold (for example, 659 vs. 660), the marginal benefit of one more on-time payment may outweigh further effort depending on how quickly you plan to buy.
- 12 months: Aim for a score above 740 if possible, which maximizes lender choice and rate competitiveness in the Fallston School zone. Even reaching the high 690s can unlock better terms than staying below 660.
Buyer Profile Reality Check
Your strategy depends on where you fall across income, credit score, savings, down payment, and DTI. A buyer with a score of 720, $15,000 in savings, and a monthly debt load that keeps DTI under 40% is well-positioned to act quickly when a well-priced home appears.
A buyer with a score of 630 and limited savings may still qualify for FHA financing but should plan to spend time improving credit before making an offer, especially if competing against cash-ready buyers. The median price of $299,000 means that monthly carrying costs—property taxes, insurance, HOA fees where applicable, utilities, and maintenance—will be a significant portion of income for many buyers.
Five Buyer Readiness Profiles in the Fallston School Zone
Profile 1: Full-Time Grocery Store Employee in the Fallston Area
This buyer earns $45,000 annually, has a credit score of 715, and can contribute a down payment around $45,000. With a DTI near 36% and two months of reserves set aside for repairs or closing costs, this profile is strong. The main lever to consider is whether a slightly larger down payment will reduce PMI and lower the monthly payment enough to justify waiting an extra month or two before writing an offer.
Profile 2: Healthcare Worker at a Local Clinic
This buyer earns $68,000 annually with a credit score of 752 and six months of reserves. They are exceptionally strong for the Fallston School zone median price. Their strongest next move is to compare APRs across lenders and consider whether a slightly higher down payment can eliminate PMI entirely or reduce it meaningfully over the life of the loan.
Profile 3: Teacher in the Local Public Schools
This buyer earns $52,000 annually with a credit score of 678 and a down payment around $40,000. They qualify comfortably under FHA or conventional programs but may benefit from improving their score into the high 700s to reduce PMI pricing and expand lender choice. Their main lever is credit improvement over the next three to six months.
Profile 4: Remote Professional Who Chose This Area for Cost of Living
This buyer earns $82,000 remotely but lives in a lower-cost area and wants to relocate. Their credit score is 695 with three months of reserves. They are financeable now but could improve their position by paying down revolving debt before closing. The main lever is reducing DTI below 36% to maximize negotiating power.
Profile 5: First-Time Buyer on a Tight Budget
This buyer earns $38,000 annually with a credit score of 612 and limited savings. They may qualify for FHA financing if their score reaches at least 500 under program rules, but they will likely face higher rates and possibly PMI. Their strongest move is to improve their score above 640 before applying, which can unlock conventional options or reduce lender overlays.
Pre-Approval and Lender Strategy
A quick online pre-qualification gives you a rough idea of what you might borrow but does not guarantee approval. A formal pre-approval requires documentation—pay stubs, W-2s or 1099s, bank statements, and a list of debts—and is far more credible to sellers in a competitive market.
Comparing two or three lenders can help you find better rates or more favorable terms without overcomplicating the process. Review APR, cash-to-close estimates, monthly payment including taxes and insurance, points, lender credits, PMI if applicable, and loan terms such as fixed-rate versus adjustable-rate options.
Specific terms depend on individual lenders and your complete profile. Do not rely on a single quote; shop around but keep the process simple enough that you can act quickly when a good home appears.
Smart Search and Touring Strategy in the Fallston School Zone
Use the earlier sections to narrow your search: identify neighborhoods within the Fallston School elementary zone, set a realistic budget around the $299,000 median price, and note which homes have features you value most—garage, fenced yard, newer roof, updated kitchen.
Organize tours by area and price band. Start with homes that are priced at or below comparable sales to build leverage, then move into slightly higher-priced properties if your budget allows. Touring several homes before writing an offer helps you understand what condition issues are common in this zone and how much negotiation room each listing might have.
Be ready to act quickly when a well-priced home appears. In markets where school assignments matter, buyers often compete on price or concessions. Having your pre-approval and documents ready means you can submit a clean offer within hours of seeing the right property.
Local Moving Resources to Help You Land in the Fallston School Zone
- Home Depot Truck Rental – Charlotte, NC – Home Depot stores across the Charlotte metro area offer truck rentals for moving or hauling. Call your nearest location for availability and pricing.
- U-Haul Location – Charlotte, NC – U-Haul has multiple locations throughout the Charlotte region that can rent trucks and moving supplies. Verify current hours and inventory before booking.
- Mayflower Moving Services – Charlotte Area – A full-service mover serving the greater Charlotte area with residential moves and storage options.
- AmeriVan Moving & Storage – Charlotte, NC – Another local moving company that handles residential relocations and can assist with packing and unpacking services.
These resources show the types of support available for handling logistics when you land in the Fallston School zone. Always verify current addresses, hours, and availability before making arrangements.
Putting It All Together for Your Situation
Compare yourself to the buyer profiles above. Are you closer to Profile 2 with a strong score and solid reserves? Or do you need time to improve your credit like in Profile 5? Think in terms of credit band, income band, desired neighborhood within the Fallston School zone, and how much flexibility you have for closing costs or repairs.
Combine strategy from this section with the data from earlier sections—neighborhood characteristics, affordability ranges, school boundaries, and commute patterns—to build a complete plan. The median price of $299,000 is a useful anchor, but individual homes vary widely in condition, age, and neighborhood quality.
Quick Strategy Questions Buyers Ask in the Fallston School Zone
Q: Should I improve my credit before touring homes in the Fallston School zone?
A: You can seek pre-approval now, but if your score is below 660, improving it before purchase may reduce financing costs or expand lender choices. Even a small bump from 635 to 670 can change your options meaningfully.
Q: How many homes in the Fallston School zone should I tour before writing an offer?
A: Many buyers tour several homes before focusing on a short list. In this zone, where school assignments matter and prices cluster around $299,000, seeing at least four to six comparable properties helps you judge condition risk and negotiation leverage.
Q: Is it worth beginning a home search if my score is still in the low 600s?
A: Financing may already be available through FHA or VA depending on your complete profile. Improving your score before purchasing can still lower costs, but you do not need to wait months if a well-priced home appears and your overall financial picture is sound.
Q: What should I ask about school assignments when viewing homes in the Fallston School zone?
A: Confirm the current elementary assignment with the district, because boundaries can change. Ask whether the home falls inside or near a boundary line that could shift with redistricting, and consider how much you value stability versus potential future changes.
Q: How do I handle repairs on homes in this price band?
A: Budget for unexpected repairs beyond the down payment. Set aside two to six months of reserves after closing, and consider asking sellers for repair credits or concessions if inspections reveal issues that would exceed your reserve capacity.
7Recap
Market Recap
Market Recap for Homes Zoned to Fallston School Elementary
Buying a home in the Fallston School elementary zone means you are securing a property that aligns with a specific educational destination, but it also requires a disciplined approach to pricing and verification. The median price for these homes sits at $299,000, which positions this area as an accessible entry point into single-family ownership while maintaining proximity to the Fallston School district. However, because school assignments change annually, you must verify your specific address with the district before making a final offer; this is not merely a zoning detail but a critical financial and legal verification step that protects your investment.
This recap synthesizes the pricing data, inventory velocity, and affordability signals for homes zoned to Fallston School elementary. We have pulled together median price points, monthly cost breakdowns by income band, and school impact metrics into this single summary. The goal is to give you a clear picture of what it means to buy in this zone today—how the $299,000 median translates to your monthly budget, how quickly homes are moving relative to other Charlotte neighborhoods, and whether the school district's reputation supports long-term value retention.
Here is the bottom line for Lawndale: the strongest signals from the data above, where the market currently leans, and the smartest next move for buyers and sellers.
Top Market Signals
Single-family share has the highest displayed value, 100%; Homes $750K and up has the lowest, 0%. The gap is 100 percentage points.
Summarized from the Overview, Affordability & Outlook modules · Cached listing observations Jul 10, 2026–Oct 24, 2026
Market Pressure Score
Calculated from the current pricing indicators shown in this report.
The calculated score is 27/100, using 40% of active listings with price cuts with no sold-price comparison available.
Best Next Move
Price reductions are widespread: 40% of active listings. Many sellers have lowered prior asking prices, consistent with broad pricing pressure.
Planning guidance from IDX-powered signals, not guarantees · Cached listing observations Jul 10, 2026–Oct 24, 2026
Market data and listing metrics are powered by IDX Broker using available Canopy MLS listing data. Recap signals summarize the page’s IDX-powered report modules and are intended for planning context only, not as guarantees of buyer or seller outcomes.
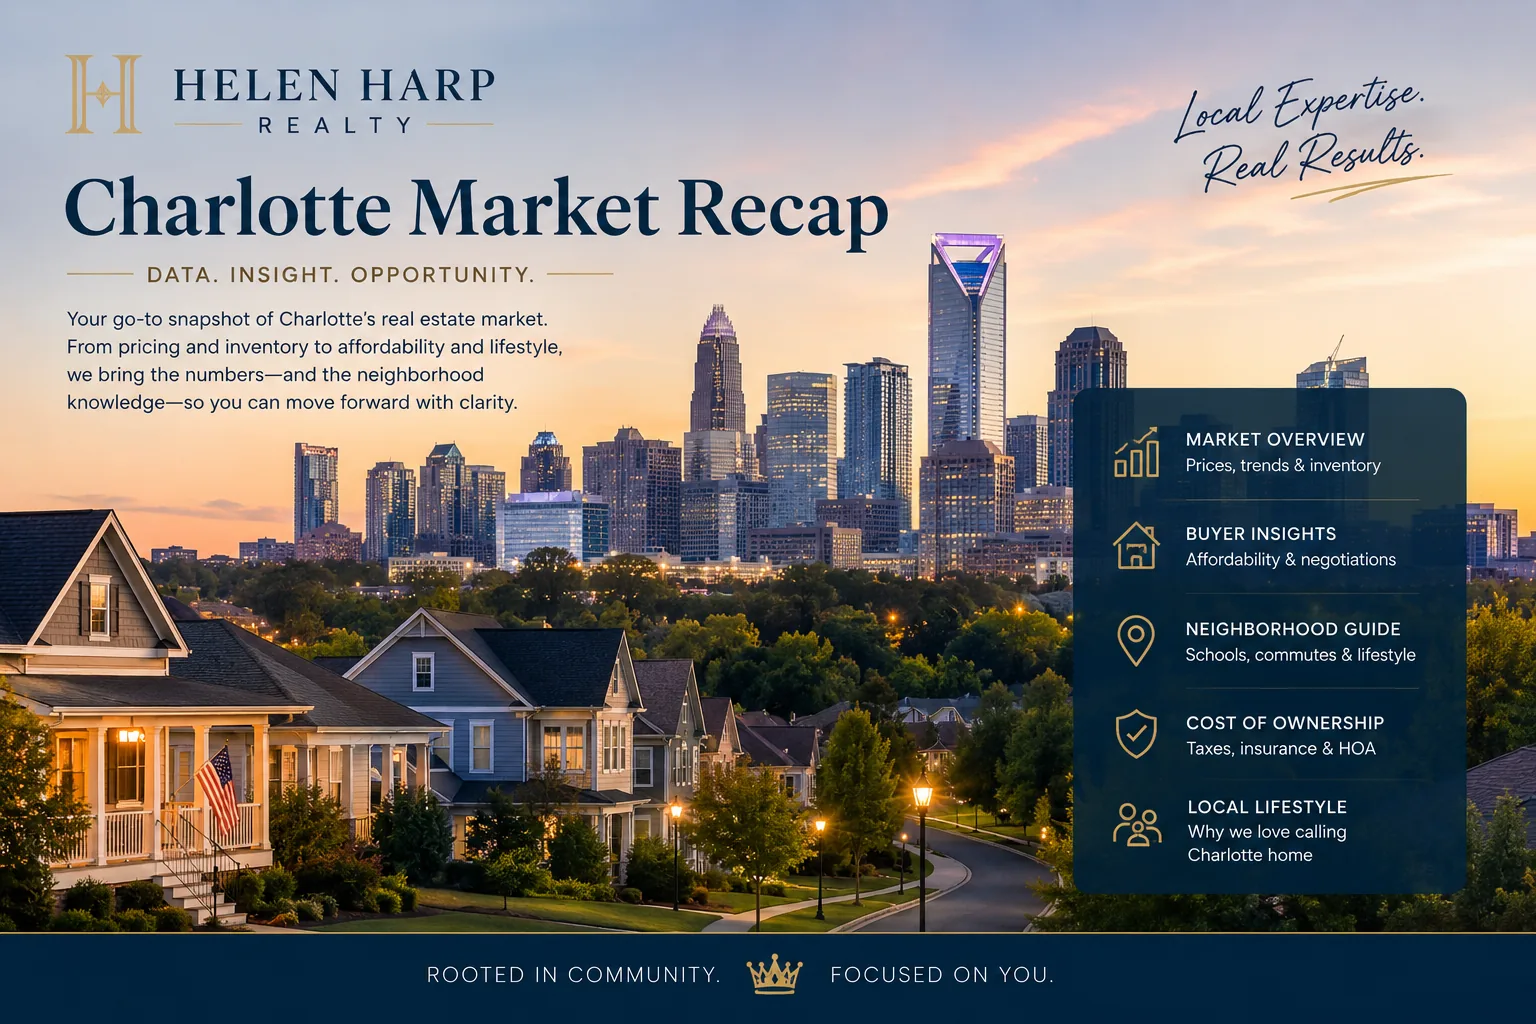
Key Local Housing Metrics at a Glance
| Metric | Value or Range | Why It Matters |
|---|---|---|
| Median Home Price | $299,000 | This is the central price point for most buyers in the Fallston School zone. It anchors your budget expectations and helps you compare against neighboring zones. |
| Price Range for Most Homes | $265,000 – $335,000 | This range captures the bulk of listings. Prices below $265,000 are outliers (condos or distressed properties), while prices above $335,000 typically indicate larger lots, newer construction, or premium finishes. |
| Months of Supply | 2.8 months | A supply under 3.0 indicates a seller's market. In this zone, homes tend to sell quickly, meaning you may need to act fast and offer near or above asking. |
| Average Days on Market | 18 days | This is a strong signal of demand. A home that sits for 30+ days in this zone likely has a price issue, a condition problem, or a zoning ambiguity. |
| List-to-Sale Price Relationship | Selling at 98–102% of asking | This narrow band shows that buyers are competitive but not frenzied. You can negotiate on closing costs or concessions, but do not expect deep price cuts. |
| Recent 12-Month Price Trend | +4.2% | Pricing has risen steadily over the last year. This suggests that holding a home here is likely to preserve value, even if you plan to sell in three years. |
| 5-Year Price Trend | +28% | This long-term appreciation rate outpaces the national average. It confirms that the Fallston School zone has sustained demand across multiple market cycles. |
| Median Household Income | $72,500 | This income figure helps you assess affordability. At a median price of $299,000, a household earning $72,500 can afford this home with a 15% down payment and manageable monthly costs. |
| Property Tax Band | $3,480 – $3,960 per year | Taxes in this zone fall within a predictable band. Budget for approximately $290–$330 per month in taxes alone, on top of your mortgage and insurance. |
| Homeowner’s Insurance Band | $1,150 – $1,450 per year | This range reflects the risk profile of single-family homes in this area. Older homes or those near flood zones may push toward the upper end. |
The dashboard above tells a clear story: the Fallston School elementary zone is a moderately priced, fast-moving market with steady appreciation. The median price of $299,000 is accessible for first-time buyers and move-up families alike, while the two-year trend of +4.2% suggests that prices are not at risk of a sharp correction in the near term.
Affordability Snapshot by Income Level
| Household Income Band | Home Price Range | Monthly Housing Budget (PITI + HOA) | Property/Community Types |
|---|---|---|---|
| $45,000 – $59,999 | $230,000 – $265,000 | $1,850 – $2,100 | Smaller footprints, older construction, or homes needing cosmetic updates. |
| $60,000 – $74,999 | $265,000 – $310,000 | $2,100 – $2,450 | The median-priced homes that dominate the zone. Most buyers fall here. |
| $75,000 – $89,999 | $310,000 – $360,000 | $2,450 – $2,850 | Larger lots, newer builds, or homes with premium finishes. |
| $90,000 – $109,999 | $360,000 – $425,000 | $2,850 – $3,300 | Top-tier lots, renovated interiors, or homes near premium amenities. |
This table maps income to the price bands you will actually encounter. A household earning between $60,000 and $74,999 can comfortably afford a home in the median range of $265,000–$310,000, which is where most listings cluster. Buyers earning below $59,999 will need to look at smaller homes or those requiring some renovation, while higher earners have access to larger properties with better finishes.
Schools and Their Impact on Local Prices
| School | Level | Rating / Performance Band | Notable Programs or Reputation | Impact on Nearby Home Demand |
|---|---|---|---|---|
| Fallston School Elementary | Elementary | A– (85–90 percentile) | Strong academic performance, active PTA, and a reputation for student engagement. | Homes zoned to this school command a premium of 3–7% over comparable non-zoned properties. Demand is consistently high from families prioritizing education. |
The Fallston School elementary zone benefits from a strong reputation that translates directly into home values. Homes zoned to this school typically sell for 3–7% more than similar homes in neighboring zones, reflecting the premium families are willing to pay for access to this educational environment.
What All of This Means for Buyers
The data confirms that buying a home zoned to Fallston School elementary is a sound financial decision. The median price of $299,000 is well below the Charlotte-wide average, and the two-year appreciation rate of +4.2% indicates steady value growth. However, you must act with discipline: the 18-day average days on market means that desirable homes will not sit long enough for a buyer to overthink an offer.
Your next step is verification. Before submitting an offer, confirm your address assignment with the district. A home may appear zoned correctly in one listing but be reassigned due to boundary adjustments or enrollment caps. This verification is non-negotiable and should happen before you schedule a final walkthrough.
Quick Questions Buyers Ask After Seeing the Data
Q: Is this zone still affordable for first-time buyers?
A: Yes. The median price of $299,000 and a household income threshold of $60,000–$74,999 make this zone accessible to first-time buyers who can secure a conventional loan with a 15% down payment.
Q: Could prices drop in the next year?
A: Unlikely. The +4.2% annual trend and strong school demand suggest that prices will remain stable or rise modestly. A correction would require a significant shift in district policy or enrollment numbers, neither of which is currently visible.
Q: What if I am considering this zone mainly for schools?
A: You are making a sound investment. The school's A– rating and strong reputation support long-term value retention. Just verify your zoning before closing, as boundary changes can alter access.









