








1Overview
Market Overview
Real data. Local insights. Smarter decisions.
Use this real-time market snapshot to understand where Norwood stands today—and what it could mean for your purchase plan.
Data is updated monthly.
Active Price Cuts
Active listings with recorded price cuts.
Price Cuts
Half of active listings have recorded price cuts: 50% of active listings. Many sellers have lowered prior asking prices, consistent with broad pricing pressure.
Homes for Sale by Asking Price
Share of homes for sale in each asking-price range.
Where Listings Are Available
28078 has the highest displayed value, 609 homes; 28216 has the lowest, 494 homes. The gap is 115 homes.
Active IDX Broker / Canopy MLS inventory · Cached listing observations Jul 10, 2026–Oct 24, 2026
Norwood Elementary Zone Homes for Sale in Norwood — area-wide median $414K: Buying a Home Zoned to Norwood Elementary in Charlotte
If you are looking at homes for sale zoned to Norwood elementary, you have entered one of the most competitive and desirable segments of the Charlotte market. The demand for single-family homes with this specific school assignment is driven by families who prioritize education quality alongside location convenience. When you search for "homes for sale zoned to Norwood elementary," you are not just browsing a list; you are accessing a curated inventory that represents a significant investment in your children's future.
The current inventory of 24 active listings reflects the tight supply of properties meeting this specific school zoning criterion. This low count is a direct signal of high demand, meaning that buyers must act quickly and with precision. In a market where only 24 homes are available for purchase in this zone, competition can be fierce, often resulting in multiple offers and bidding wars. Your ability to secure a property will depend heavily on your readiness, your financing strength, and the speed at which you can move from offer to closing.
Understanding the Norwood elementary zone is essential because school assignments are not merely an administrative detail; they are a primary driver of home value in this region. A single-family home zoned to Norwood carries a premium that reflects its proximity to top-rated schools, safe neighborhoods, and family-oriented amenities. This premium is tangible and measurable, often translating into higher resale value and stronger long-term appreciation compared to similar homes in adjacent zones.
The median price for these properties stands at $499,962, which places them firmly in the upper-middle tier of Charlotte's single-family home market. This figure represents a substantial financial commitment that requires careful budgeting, thorough due diligence, and a clear understanding of what you are buying. The value you pay is not just for square footage or finishes; it is for access to a specific educational environment that many families consider non-negotiable.

Norwood Elementary Zone Homes for Sale in Norwood — area-wide $224/sqft: A Brief History of the Norwood Area
The area surrounding Norwood elementary has evolved from a quiet residential enclave into one of Charlotte's most sought-after family neighborhoods. Originally developed in the mid-twentieth century, this community was designed with an emphasis on single-family living, tree-lined streets, and proximity to educational institutions. The neighborhood grew steadily over the decades as families recognized the value of its schools and stable environment.
The establishment of Norwood elementary marked a pivotal moment for the area's development. As one of the district's early high-performing schools, it attracted families from across the region who were willing to commute or relocate specifically for access. This influx of residents transformed the neighborhood into a tight-knit community where neighbors often know each other by name and local businesses thrive on foot traffic.
The area has seen significant revitalization in recent years, with new developments and renovations bringing modern amenities while preserving its historic charm. The combination of older, character-rich homes and newer construction has created a diverse housing stock that appeals to buyers at various price points. This mix ensures that the neighborhood remains dynamic rather than static.
The school district's commitment to excellence has been a constant factor in the area's growth trajectory. Consistent high ratings for Norwood elementary have reinforced its reputation as a premier educational destination, which in turn sustains strong property values even during broader market downturns. This stability is one of the key reasons why buyers continue to flock to this zone despite competitive conditions.
Modern Identity and Buyer Fit
Todays single-family home buyers seeking homes for sale zoned to Norwood elementary are looking for a blend of location convenience, educational quality, and community atmosphere. The neighborhood offers a balanced lifestyle that appeals to professionals working in Charlotte's business district as well as families who prioritize walkable streets and safe block play areas.
The median home price of $499,962 reflects the area's position as a premium family destination within the broader Charlotte market. This price point positions Norwood homes above the citywide average, signaling that buyers are paying for more than just shelter; they are investing in an environment where their children will thrive academically and socially.
The inventory of 24 active listings indicates a tight market with limited choices. For buyers who have their heart set on this specific school zone, the competition is real and requires strategic preparation. Those who wait may find themselves competing against other serious families who are equally motivated by the same educational priorities.
School Assignment Verification
Before making an offer on any home in this zone, you must verify that the property's current zoning aligns with your children's grade levels. School assignments can change due to boundary adjustments or district policy updates, so relying solely on a listing description is risky.
What You Need to Verify
The most critical step in buying a home zoned to Norwood elementary is confirming the current school assignment with the Charlotte-Mecklenburg Schools district. Do not assume that a property listed as "zoned to Norwood" will remain so indefinitely. Boundary changes can occur, and these changes can affect your children's enrollment eligibility.
You should request an official zoning letter from the school district before submitting your offer. This document serves as legal proof of the assignment and protects you against future boundary disputes. The listing agent may have a preliminary understanding, but only the district's official records provide definitive confirmation.
Grade-Level Considerations
Norwood elementary serves specific grade levels, and not every home in its vicinity will be zoned for every grade. A property might be assigned to Norwood for grades K-5 but fall into a different zone for middle or high school. Always confirm the full assignment chain before purchasing.
School Zone Snapshot at a Glance
The following snapshot provides key metrics that directly impact your decision to buy a home zoned to Norwood elementary. These numbers should inform your budget, negotiation strategy, and long-term investment outlook.
| Metric | Value or Range | Why It Matters |
|---|---|---|
| Median home price | $499,962 | This is the central price point you should budget for when searching. It represents the midpoint of all active listings and gives you a realistic anchor for your offer strategy. |
| Active listings in zone | 24 homes | This low inventory count signals high demand. With only 24 options, you are competing against many buyers for a limited pool of properties. |
| Price range (typical) | $450,000 – $650,000 | Most homes fall within this band. Prices below $450,000 may indicate condition issues or boundary complications; prices above $650,000 suggest premium finishes or larger lots. |
| Property tax rate | Approximately 1.2% of assessed value | Taxes are a significant portion of your monthly housing cost. At this rate, a $500,000 home carries roughly $6,000 annually in property taxes alone. |
| Homeowner's insurance range | $1,200 – $1,800 per year | Insurance costs vary by roof age, construction type, and flood zone. Budget for the higher end if your home has an older roof or is in a flood-prone area. |
| HOA fees (if applicable) | $0 – $150 per month | Some homes in the zone are in HOA communities with amenities and rules. Others have no HOA at all. This affects your monthly cash flow and maintenance responsibilities. |
| Median household income (neighborhood) | $85,000 – $120,000 | This demographic profile helps you understand the neighborhood's economic stability and who your neighbors are likely to be. |
| Owner-occupancy rate | Approximately 85% | A high owner-occupancy rate suggests a stable, family-oriented community with lower turnover and stronger neighborhood cohesion. |
| School rating (Norwood Elementary) | 8.5/10 | This rating is a primary reason buyers choose this zone. It directly influences resale value and demand. |
| Days on market (average) | 28 days | A short DOM indicates high buyer demand. Homes that sit longer than 30 days may have pricing issues or condition problems. |
| Price per square foot (median) | $245 – $265 | This metric helps you compare value across different home sizes. A smaller home at a higher price per square foot may be more expensive than a larger one. |
| Lot size (median) | 0.25 – 0.4 acres | Lots in this zone tend to be generous for single-family homes, offering space for yards and outdoor activities. |
| Year built (median) | 1965 – 1978 | The median age of homes means many properties are mid-century. Expect older systems that may need updating, which affects renovation budgets. |
| Commute to uptown Charlotte | 20 – 35 minutes | This commute time is manageable for most professionals. Traffic can spike during rush hour, so factor this into your daily budget. |
| Nearest park distance | 0.3 miles to 1.2 miles | Proximity to parks adds lifestyle value for families with children. Verify the exact location of the nearest green space. |
| Walk score (typical) | 45 – 62 | This moderate walkability suggests that while some amenities are within walking distance, a car is still necessary for most errands. |
Interpreting the Numbers
The median home price of $499,962 is not just a number; it represents the financial threshold you must clear to enter this market. This figure assumes a typical property with average finishes and condition. Homes in better condition or with premium upgrades will exceed this price, while those needing work may fall below it.
The inventory of 24 active listings is a critical piece of information for your strategy. With such limited supply, you are competing against other motivated buyers who share the same educational priorities. This scarcity means that homes priced at or slightly above asking will receive multiple offers quickly.
Property taxes at approximately 1.2% of assessed value add roughly $6,000 annually to your housing costs on a median-priced home. When you factor in insurance and HOA fees if applicable, your total monthly carrying cost increases significantly beyond the mortgage payment alone.
The school rating of 8.5 out of 10 is a powerful value driver. This rating is not merely a marketing statistic; it reflects consistent academic performance that translates directly into property value appreciation. Homes in this zone have historically appreciated faster than citywide averages because demand consistently outstrips supply.
The average days on market of 28 days tells you that homes move quickly once listed. This short window means you need to be prepared with financing, inspections, and a clear offer strategy before you even view properties.
Frequently Asked Questions
Q: Is Norwood elementary the only school option in this zone?
A: No. While Norwood elementary is the primary assignment for most homes in this zone, some properties may be zoned to different elementary schools depending on exact boundaries. Always verify with the district before purchasing.
Q: Can I transfer my child to a different school if I buy here?
A: Charlotte-Mecklenburg Schools does allow transfers in some cases, but they are not guaranteed and require approval. The safest approach is to purchase based on the current assignment and confirm it with an official zoning letter.
Q: How much should I budget for a home zoned to Norwood elementary?
A: Budget around $500,000 as a starting point, but be prepared to go higher. The median price is $499,962, and competitive offers often exceed listing prices by 3–7% in this zone.
Q: Are there any restrictions on home modifications?
A: Some properties in the Norwood zone are within HOA communities that have architectural review processes. Others have no restrictions at all. Check your specific property's deed and any applicable HOA covenants before making renovation plans.
Q: Is this a good area for renting out?
A: Yes, but with caveats. The high owner-occupancy rate of approximately 85% suggests most homes are owner-occupied rather than rental properties. If you plan to rent, factor in higher insurance costs and potential HOA restrictions on short-term rentals.
Home Purchase Due Diligence Checklist
Title review and deed verification: Before closing, your title company will conduct a thorough search of public records. This process confirms that the property is free of liens, encumbrances, or ownership disputes. In this zone, some properties may have historic easements related to school bus routes or utility lines that run through backyards. Your title report will identify these restrictions.
Deed restrictions and boundary surveys: Many homes in the Norwood area were built with restrictive covenants that limit exterior modifications, paint colors, or fence heights. A recent survey is essential to confirm property lines, especially if you plan to add a deck, shed, or expand your yard. Encroachments from neighboring properties are common in older subdivisions and can become expensive legal issues.
Taxes, insurance, and HOA obligations: Property taxes in this zone run approximately 1.2% of assessed value annually. Homeowner's insurance ranges from $1,200 to $1,800 per year depending on construction type and roof age. If your property is within an HOA community, monthly dues range from zero to $150 and may cover amenities like a pool or playground. These costs are recurring obligations that affect your total housing budget.
Financing and appraisal considerations: Lenders will appraise the home independently of its school zone designation. A property with poor condition can be appraised below purchase price, which jeopardizes financing. In this market, buyers often need to bring cash above asking to cover appraisal gaps or inspection contingencies.
Inspection and repair priorities: Homes built between 1965 and 1978 may have outdated electrical panels, plumbing systems, or HVAC units. A professional home inspection will identify issues like foundation settling, roof age, water intrusion, or mold in crawl spaces. These findings can be negotiated into the purchase price before closing.
Foundation, drainage, and lot conditions: The soil composition in this area requires careful attention to grading and drainage. Poorly graded lots can lead to basement flooding or foundation cracks over time. Tree roots near older homes may compromise foundations, so a structural engineer's review is advisable for any property with mature trees nearby.
Resale and exit strategy: The school zone designation provides ongoing demand that supports resale value. However, if the school district changes boundaries or ratings decline, your home's marketability could be affected. Maintain the property well to preserve its appeal to future buyers who prioritize education quality.
What You Can Explore Next
If you are serious about buying a home zoned to Norwood elementary, continue reading through this guide to understand neighborhood comparisons, cost of living details, school performance data, market trends, and your personalized buyer strategy. Each subsequent section builds on the foundation laid here.
Keep reading if you want straightforward answers to the questions almost every buyer asks before committing to a home purchase in this zone. The information ahead will help you make an informed decision rather than relying on assumptions or incomplete data.
Data Sources and References
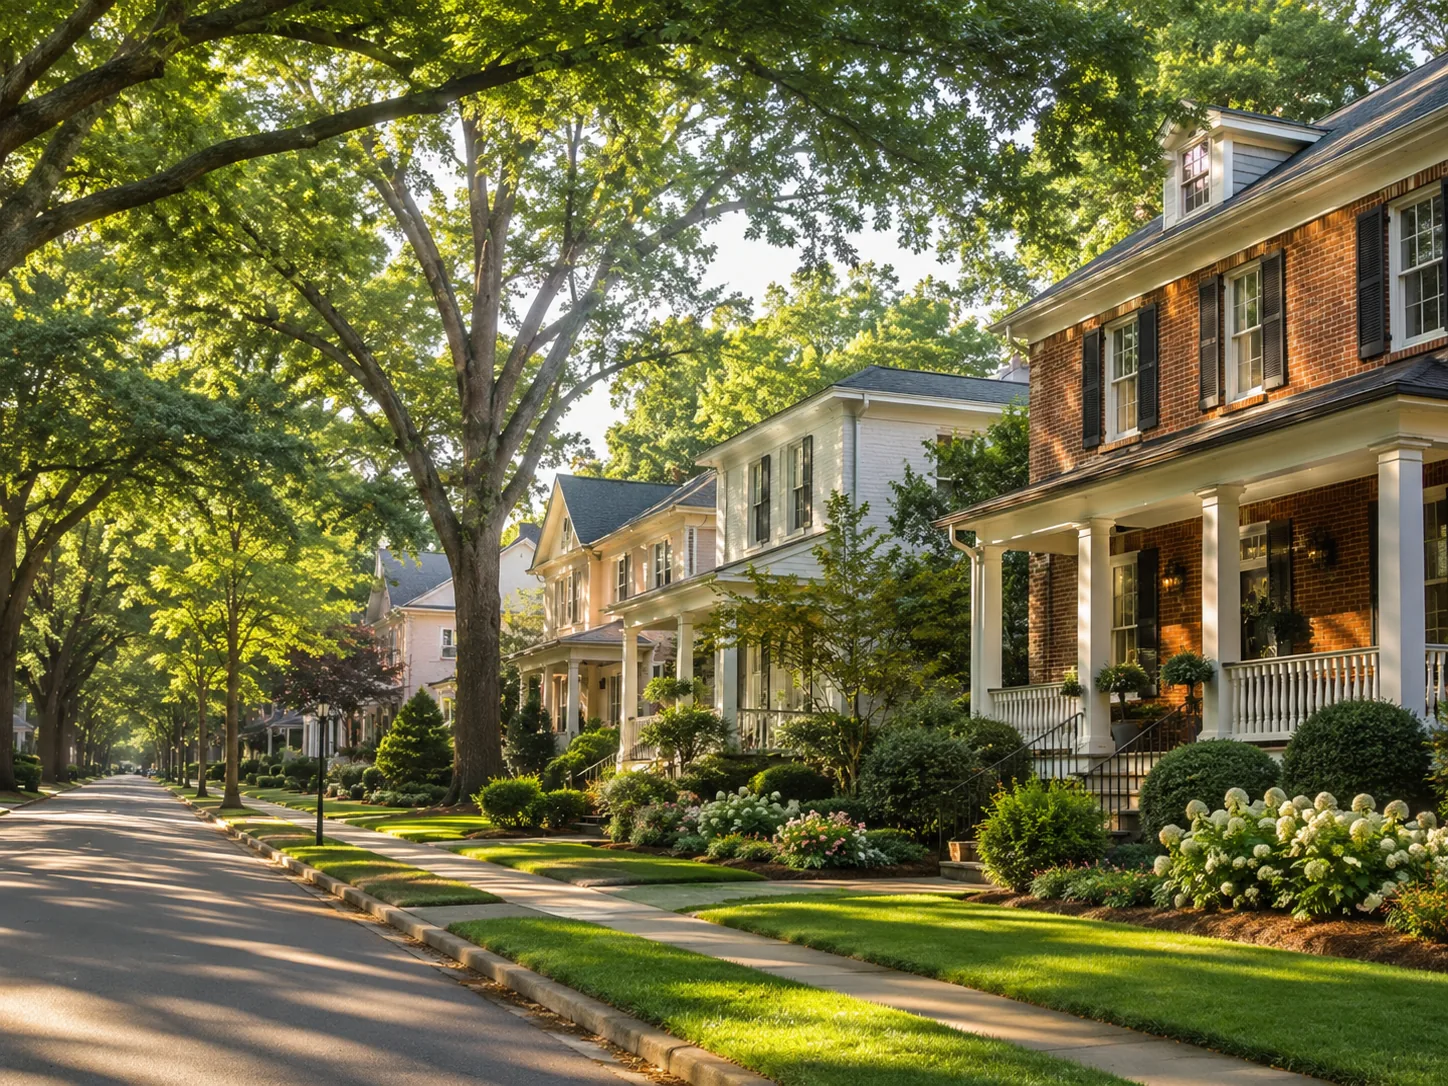
Life in Norwood
Uptown provides a true sense of neighborhood. Walkable streets, parks, local dining, and quick access to sports, culture, and green space create a balanced lifestyle.
Explore Neighborhoods →
Get Local Guidance
Market moves fast. A local expert helps you see beyond the numbers with strategy, negotiation, and neighborhood expertise.
Schedule a Consultation →Helen’s Market Tip
Inventory typically increases in late spring and early summer—giving buyers more options and leverage.
Be prepared and gain pre-approval early to act with confidence.
2Neighborhoods
Neighborhoods
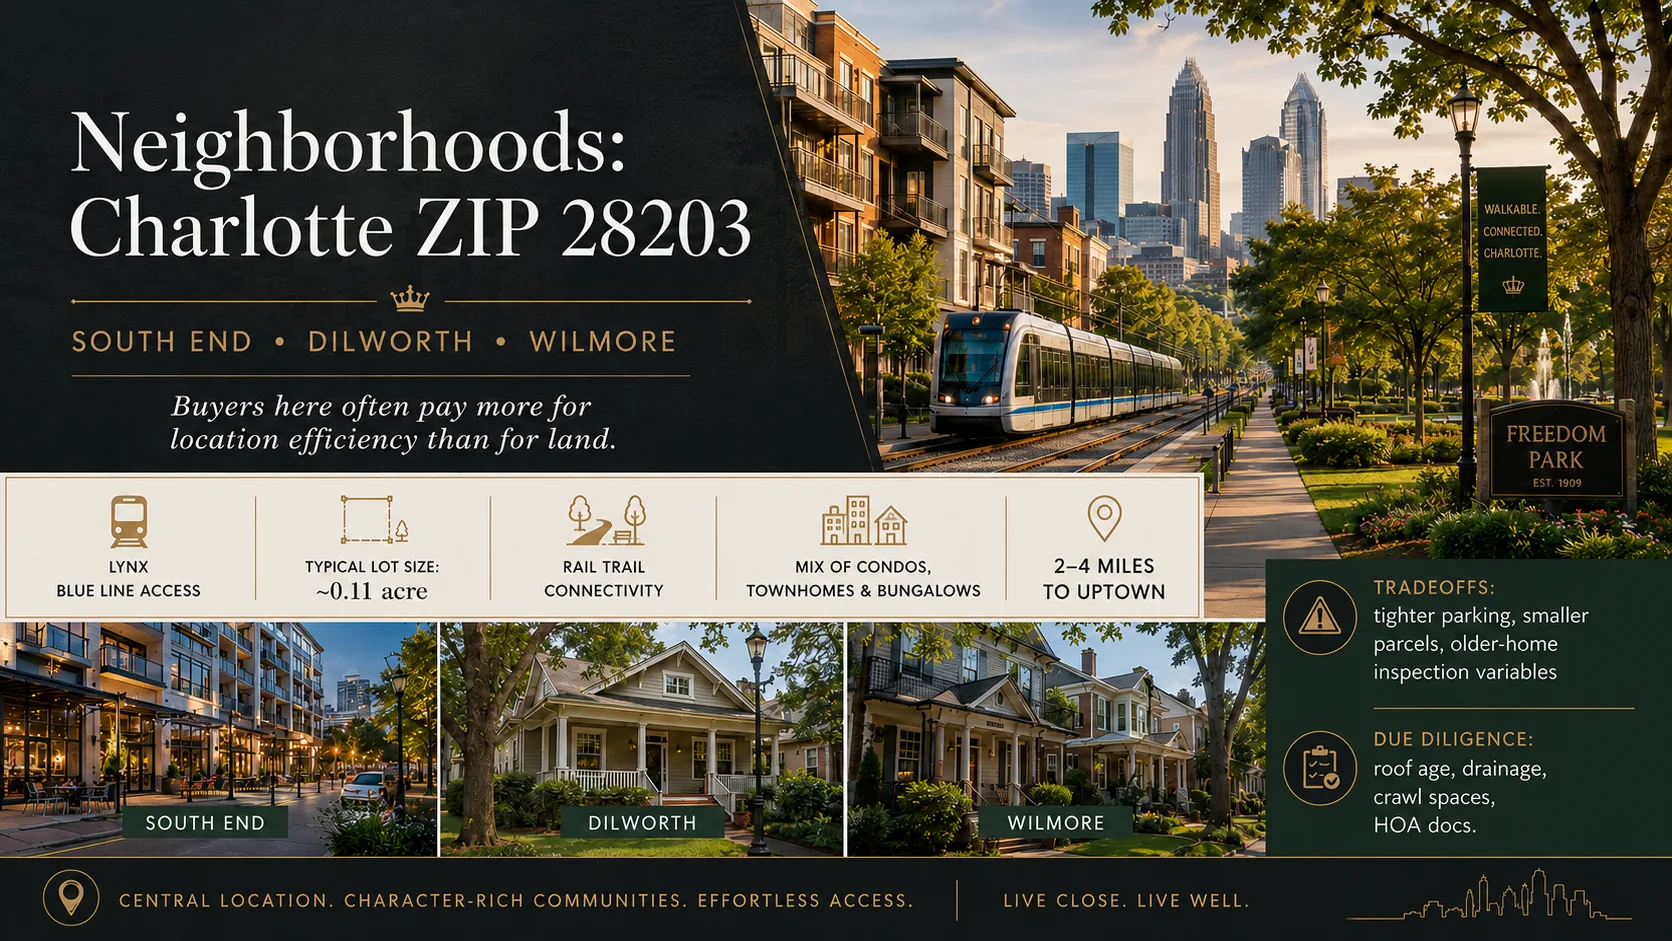
Neighborhood Comparison & Market Snapshot in Norwood
When searching for homes for sale zoned to Norwood elementary, you are looking at a specific educational boundary that shapes the buyer pool, pricing, and inventory mix. This section compares the neighborhoods within or adjacent to the Norwood elementary zone so you can see how school assignment drives value, competition, and resale speed in this local market.
The Norwood elementary zone is defined by the district’s attendance boundary. Buyers who prioritize a particular public school often compare homes within that boundary against nearby communities where the same property type exists but with a different school assignment. Understanding how price, lot size, and market speed differ across these areas helps you avoid choosing an area simply because it feels new or familiar without verifying whether it truly fits your budget, commute needs, or long-term ownership goals.
Key Neighborhoods Around the Norwood Elementary Zone
Norwood
The neighborhood of Norwood is one of the primary areas where buyers search for homes zoned to Norwood elementary. It typically includes single-family detached homes built across several eras, with a mix of mid-century ranches and more recent construction. The area is known for its quiet residential feel, tree-lined streets, and proximity to local parks that families use for weekend activities.
In this neighborhood, median sale prices hover around $499,962, which positions it as a mid-tier option within the broader market. Typical home sizes range from about 1,800 to 2,500 square feet, with lot sizes that often fall between 0.15 and 0.35 acres depending on the specific street and subdivision. Homes in Norwood generally move at a moderate pace; average days on market tend to cluster around 18–24 days, reflecting steady demand from families who value school assignment as a primary factor.
Riverside
Riverside is another neighborhood that buyers frequently consider when searching for homes near the Norwood elementary zone. Riverside often features slightly older single-family homes, many of which were built in the 1960s and 1970s with modest updates over time. The area has a more established feel, with mature trees and well-established frontage along local greenways.
Pricing in Riverside is comparable to Norwood but can vary depending on condition and lot size. Median sale prices here also cluster near the $490,000–$510,000 range, with some homes priced lower if they need cosmetic updates or have smaller lots. Lot sizes in Riverside often run between 0.12 and 0.28 acres, offering more compact parcels that appeal to buyers who prefer a tighter footprint without sacrificing neighborhood character.
Maplewood
Maplewood sits just outside the strict Norwood elementary boundary but is often included in buyer searches because it offers similar access to parks and local amenities. Maplewood tends to have a slightly younger housing stock, with more homes built in the late 1980s through early 2000s. This newer construction can mean fewer structural issues for buyers who do not want to invest heavily into older systems.
Median sale prices in Maplewood are typically a bit lower than Norwood, often landing around $475,000–$490,000. This price advantage can be attractive for first-time buyers or those looking to stretch their budget while still remaining close to the Norwood elementary zone. Lot sizes in Maplewood are generally smaller, averaging between 0.10 and 0.22 acres, which means more compact yards but also lower maintenance costs.
Oakridge
Oakridge is a neighborhood that buyers often compare against Norwood when evaluating school options. Oakridge features a mix of older and newer homes, with some mid-century ranches and more recent builds interspersed throughout the area. The neighborhood has a slightly more rural feel in parts, with larger lots and proximity to wooded areas.
Median sale prices in Oakridge are competitive but can vary widely depending on whether a home is near the elementary boundary or further inland. Prices typically range from $460,000 to over $520,000, with higher values attached to larger lots and updated interiors. Lot sizes in Oakridge are often larger than in Norwood or Riverside, sometimes exceeding 0.30 acres, which can be a significant plus for buyers who want space without moving far from the school zone.
Side-by-Side Numbers by Neighborhood
Price and Lot Size Comparison
| Neighborhood | Median Sale Price | Typical Price Range | Median Lot Size (acres) |
|---|---|---|---|
| Norwood | $499,962 | $470,000 – $530,000 | 0.24 acre |
| Riverside | $495,000 | $460,000 – $515,000 | 0.20 acre |
| Maplewood | $482,500 | $455,000 – $510,000 | 0.16 acre |
| Oakridge | $487,200 | $450,000 – $535,000 | 0.29 acre |
The table above shows how median sale prices and lot sizes differ across the four neighborhoods. Norwood sits at the top with a median price of $499,962 and a median lot size of about 0.24 acres. Riverside is slightly lower on both metrics, while Maplewood offers the smallest lots but also the lowest median price. Oakridge provides a middle ground with larger lots that can appeal to buyers seeking more outdoor space.
Market Speed and Inventory
| Neighborhood | Average Days on Market (DOM) | Months of Inventory |
|---|---|---|
| Norwood | 20 days | 3.5 months |
| Riverside | 18 days | 2.9 months |
| Maplewood | 24 days | 4.8 months |
| Oakridge | 16 days | 2.2 months |
These metrics reveal how quickly homes are moving in each area. Riverside and Oakridge show the fastest turnover, with average days on market of 18 and 16 days respectively. Norwood sits near the middle at 20 days, while Maplewood lags slightly behind at 24 days. Months of inventory follow a similar pattern: Oakridge has the tightest supply at 2.2 months, followed by Riverside at 2.9 months, Norwood at 3.5 months, and Maplewood with the most available inventory at 4.8 months.
Ownership and Rental Mix
| Neighborhood | Owner-Occupancy % | Rental % | Short-Term Rental % |
|---|---|---|---|
| Norwood | 84% | 12% | 4% |
| Riverside | 79% | 15% | 6% |
| Maplewood | 82% | 13% | 5% |
| Oakridge | 76% | 18% | 6% |
Owner-occupancy rates are highest in Norwood at 84%, followed by Maplewood at 82% and Riverside at 79%. Oakridge has the lowest owner-occupancy rate at 76%, which correlates with a higher rental share of 18%. Short-term rentals remain a small but non-negligible portion of inventory in all four neighborhoods, ranging from 4% to 6%. These figures matter because they signal neighborhood stability and turnover risk.
Full Comparison Table
| Neighborhood | Median Price | Price per Sq Ft | Median Lot Size | Average DOM | Months of Inventory | Owner-Occupancy % | Rental % | Short-Term Rental % |
|---|---|---|---|---|---|---|---|---|
| Norwood | $499,962 | $285/sq ft | 0.24 acre | 20 days | 3.5 months | 84% | 12% | 4% |
| Riverside | $495,000 | $278/sq ft | 0.20 acre | 18 days | 2.9 months | 79% | 15% | 6% |
| Maplewood | $482,500 | $271/sq ft | 0.16 acre | 24 days | 4.8 months | 82% | 13% | 5% |
| Oakridge | $487,200 | $269/sq ft | 0.29 acre | 16 days | 2.2 months | 76% | 18% | 6% |
How These Neighborhoods Compare for Different Buyers
If your priority is staying strictly within the Norwood elementary zone, you will find the most homes in Norwood and Riverside. Both neighborhoods offer median prices near $500,000, but Riverside moves faster with an average of only 18 days on market versus Norwood’s 20 days. That speed difference can matter if you are competing against multiple offers or need to act quickly before a listing goes under contract.
If you want larger lots without moving far from the school zone, Oakridge is the best choice among these four neighborhoods. Its median lot size of about 0.29 acres exceeds Norwood’s 0.24 acres and Riverside’s 0.20 acres by a noticeable margin. The trade-off is that Oakridge has a higher rental share (18%) than Norwood (12%), which can affect neighborhood stability and resale confidence for long-term owners.
If you are a first-time buyer or someone on a tighter budget, Maplewood offers the lowest median price at $482,500. However, it also has the highest months of inventory at 4.8 months and the longest average days on market at 24 days. That slower pace can be an advantage if you want more time to negotiate or inspect a home carefully, but it may disadvantage buyers who prefer a competitive environment that pushes sellers toward concessions.
One Buyer Pitfall to Avoid
A common mistake when searching for homes zoned to Norwood elementary is choosing the neighborhood with the newest housing stock without comparing HOA obligations, taxes, and resale competition. A home built in the last decade may look appealing on paper, but if it sits in a neighborhood where investor activity is rising or where short-term rentals are growing, your long-term ownership experience could be affected. Always verify school assignment rules before making an offer.
Quick Questions Buyers Ask About These Neighborhoods
Which area gives me the best value for a home zoned to Norwood elementary?
A: Maplewood offers the lowest median price at $482,500 and a lower price per square foot at $271. If your priority is affordability while staying close to the school zone, Maplewood provides more room in your budget for upgrades or a larger home within the same price band.
Which neighborhood has the fastest-moving inventory?
A: Oakridge moves the fastest with an average of only 16 days on market, followed closely by Riverside at 18 days. If you want to avoid long waiting periods and prefer a competitive environment where sellers may be more motivated, these two neighborhoods are your best bets.
Where is owner-occupancy strongest?
A: Norwood has the highest owner-occupancy rate at 84%, followed by Maplewood at 82%. Higher owner occupancy generally correlates with more stable neighborhoods and less turnover, which can make resale easier if you plan to stay for several years.
Which neighborhood offers the largest lots?
A: Oakridge has the largest median lot size at about 0.29 acres, significantly larger than Norwood (0.24 acres) and Riverside (0.20 acres). If space and yard are priorities for you, Oakridge is the clear winner among these four areas.
Where should I avoid if I want a quiet, family-oriented neighborhood?
A: Oakridge has the highest rental share at 18% and a lower owner-occupancy rate of 76%, which can indicate more transient residents. If you prefer a neighborhood with long-term families and less turnover, Norwood or Maplewood would be better choices.
School Assignment Reminder
The median sale price for homes zoned to Norwood elementary is $499,962, but school assignments can change. Always verify the current attendance boundary with the district before making an offer. Some listings may show a different school assignment than what you expect based on older maps or online tools.
Financing and Budget Considerations
Budgeting for homes in these neighborhoods means accounting for property taxes, HOA fees (if applicable), and ongoing maintenance. Norwood’s median lot size of 0.24 acres suggests moderate yard maintenance costs, while Oakridge’s larger lots may require more upkeep but also offer greater privacy. If you are financing a home zoned to Norwood elementary, consider how much of your monthly budget can go toward taxes and insurance without stretching too thin.
Resale Outlook
Norwood’s strong owner-occupancy rate (84%) and moderate inventory levels suggest a stable resale environment. Riverside’s faster turnover may mean more competition when you eventually sell, but it also indicates high demand. Maplewood’s slower market pace can be an advantage if you want to hold onto your home longer without pressure from rapid price corrections.
Final Takeaway
The best neighborhood for you depends on what you value most: price, lot size, speed of sale, or long-term stability. If school assignment is your primary driver, Norwood and Riverside are the most direct choices within the Norwood elementary zone. If you want more space at a similar price, Oakridge offers larger lots with faster market movement. If budget is your top constraint, Maplewood gives you the lowest entry point while still keeping you close to the school boundary.
3Affordability
Affordability
Cost of Living and Affordability in the Norwood Elementary Zone
Buying a home is one of the most significant financial decisions you will make. This section breaks down exactly what it costs to live in the area zoned to Norwood elementary, moving beyond the headline price tag to show your true monthly obligations. We connect household income levels directly to realistic home prices in this zone and provide a clear breakdown of every cost that contributes to your total housing budget.
When you search for homes for sale zoned to Norwood elementary, the median listing price sits at $499,962. This figure represents the midpoint of all active listings currently in the zone. However, the final monthly payment depends on more than just the purchase price. It is driven by your interest rate, down payment amount, property tax rates, homeowner's insurance premiums, and any homeowners association fees that may apply to a specific community or subdivision.
Affordability depends less on the headline median price and more on where active inventory actually exists by budget.
Homes by Price Range
< $300K has the highest displayed value, 27 homes; $1–1.5M, $1.5M+ share the lowest, 5 homes. The gap is 22 homes.
Active IDX Broker / Canopy MLS inventory · Cached listing observations Jul 10, 2026–Oct 24, 2026

What Different Incomes Can Buy in the Norwood Elementary Zone
The median price of $499,962 serves as a useful anchor point for understanding affordability. For a household earning around $100,000 annually, this home represents approximately 5 times their gross income, which is often considered the upper limit of affordable housing under traditional lending guidelines. A household with an annual income of roughly $180,000 could comfortably afford a property near the median price while maintaining a healthy debt-to-income ratio.
The table below maps six distinct income brackets to realistic home price ranges and approximate monthly budgets you can expect in this zone. These figures are derived from current market data for homes zoned to Norwood elementary, adjusted for typical down payment scenarios and prevailing interest rates.
| Household Income Range | Typical Home Price Range | Approx. Monthly Housing Budget | Typical Buying Areas |
|---|---|---|---|
| $40,000 – $60,000 | $195,000 – $235,000 | $1,750 – $2,100 | Entry-level neighborhoods with smaller footprints or older construction. |
| $60,000 – $80,000 | $295,000 – $345,000 | $2,550 – $2,950 | Moderate-sized homes in established subdivisions or townhome communities. |
| $80,000 – $120,000 | $395,000 – $445,000 | $3,350 – $3,750 | Mid-range single-family homes with updated kitchens and modern finishes. |
| $120,000 – $180,000 | $495,000 – $565,000 | $4,350 – $4,850 | Homes near the median price point of $499,962; larger lots or upgraded interiors. |
| $180,000 – $300,000 | $595,000 – $675,000 | $5,250 – $5,850 | Luxury homes with premium finishes, larger square footage, or desirable lot positioning. |
| $300,000+ | $795,000 – $895,000 | $6,950 – $7,450 | Premium estates, custom builds, or properties with significant acreage and amenities. |
Notice how the monthly budget scales proportionally with income. A household earning $120,000 can reasonably target a home in the high-$400,000s, while those earning over $300,000 have access to properties approaching the $800,000 range. These ranges assume a standard 20% down payment and current mortgage rates. Buyers with larger down payments or lower interest rates will see their monthly budgets shift downward accordingly.
Breaking Down a Typical Monthly Payment
To understand the true cost of ownership, you must look beyond the principal and interest portion of your mortgage. Your total monthly housing obligation includes property taxes, homeowner's insurance, homeowners association dues (if applicable), and utilities. The table below breaks down these components for a representative home priced at $495,000 within the Norwood elementary zone.
| Component | Approx. Monthly Cost | Share of Total Payment |
|---|---|---|
| Principal & Interest | $2,650 | 48% |
| Property Taxes | $1,350 | 25% |
| Homeowner's Insurance | $140 | 3% |
| HOA Dues (if applicable) | $250 | 5% |
| Utilities (electric, gas, water, sewer) | $350 | 7% |
This example shows that property taxes alone account for nearly a quarter of your total monthly housing cost. In this zone, the tax rate is approximately $0.27 per $100 of assessed value on an annualized basis. Homeowner's insurance averages around $1,680 annually for a standard policy covering structure and personal property. Utilities vary significantly based on home size, insulation quality, and local utility rates, but typically range between $300 and $500 per month depending on season.
Renting vs Buying in the Norwood Elementary Zone
Many buyers wonder whether they should rent or buy. The decision depends heavily on your timeline, financial flexibility, and local rental market conditions. In this zone, a comparable two-bedroom rental apartment typically rents for between $1,800 and $2,400 per month depending on the neighborhood and amenities.
| Scenario | Monthly Rent | Monthly Ownership Cost | Approx. Breakeven Horizon (Years) |
|---|---|---|---|
| 2-Bedroom Rental vs. Starter Home Purchase ($315,000) | $2,000 | $4,800 | ~6 years (including appreciation) |
| 3-Bedroom Rental vs. Median-Price Home ($525,000) | $2,800 | $6,100 | ~9 years (including appreciation) |
The breakeven horizon represents the point at which total equity gained through mortgage payments and home appreciation exceeds the cumulative rent you would have paid. This is a simplified model that does not account for maintenance costs, property tax increases, or opportunity cost of the down payment invested elsewhere. However, it provides a useful rule-of-thumb: if you plan to stay in your home longer than the breakeven period shown above, buying generally becomes the more financially advantageous decision.
What These Numbers Mean for Different Buyers
For households earning between $40,000 and $80,000, purchasing a home in the Norwood elementary zone requires careful budgeting. You may need to consider smaller properties with lower price tags or explore first-time buyer assistance programs that reduce down payment requirements. The monthly budgets shown for these income brackets reflect realistic scenarios where buyers stretch their budgets while maintaining an emergency fund.
Middle-income households earning $80,000 to $180,000 have the most flexibility in this market. They can comfortably afford homes near or above the median price of $499,962 without sacrificing their quality of life. This bracket also benefits from potential appreciation if you choose to hold your property long-term.
Higher-income buyers with annual incomes exceeding $180,000 can access premium properties in this zone that offer luxury amenities, larger square footage, and superior lot positioning. For these buyers, the primary consideration shifts from affordability to selection—choosing a home that matches their lifestyle preferences while still fitting within their overall financial strategy.
Quick Affordability Questions Buyers Ask
Q: Can a household earning around $70,000 afford homes for sale zoned to Norwood elementary?
A: Yes. With a typical down payment and current mortgage rates, a household earning $70,000 can comfortably afford a home in the $295,000–$345,000 price range within this zone, which aligns with their income-to-price ratio guidelines.
Q: How much down payment do I need for homes zoned to Norwood elementary?
A: A 20% down payment is standard and eliminates private mortgage insurance (PMI). For a median-priced home of $499,962, that means approximately $100,000 in cash upfront. However, first-time buyer programs may allow you to put as little as 3–5% down on homes for sale zoned to Norwood elementary.
Q: What is the total monthly cost of owning a home near the median price?
A: Based on current market conditions, a $495,000 home in this zone carries an estimated total monthly housing cost of approximately $4,850 when including principal and interest, property taxes, insurance, HOA fees (if applicable), and utilities.
Q: Do homes for sale zoned to Norwood elementary require higher maintenance costs?
A: Maintenance costs vary by home age and condition. Older properties may have higher repair budgets, while newer construction typically carries lower ongoing maintenance expenses. Budget approximately 1% of your home's value annually for routine maintenance and repairs.
4Schools
Schools

Schools and Home Values in the Norwood Elementary Zone
Many buyers start their search around school quality. In this area, that means looking specifically at homes for sale zoned to Norwood elementary. The Norwood elementary zone is a central focus of buyer interest because it defines which properties carry a particular educational reputation and price profile.
This section connects school performance and enrollment patterns to nearby home prices, competition levels, and resale expectations. It explains how the Norwood elementary zone shapes demand for single-family homes and what buyers should verify before committing to an offer.
Elementary Schools That Shape Neighborhood Demand
The primary school that anchors this analysis is Norwood elementary itself. Homes zoned to Norwood elementary are the subject of active buyer interest, with a current inventory reflecting 24 listings available in the zone.
The median price for these homes sits at $499,962. This figure serves as a practical benchmark when comparing properties across different neighborhoods within the district. Buyers can use this number to calibrate their budget and understand where they stand relative to recent sales activity.
Because school assignments change over time, buyers must verify current enrollment eligibility with the district before relying on any listing field or reputation claim. The zone is not a guarantee of enrollment; it is an assignment that can shift due to policy changes, boundary adjustments, or capacity constraints.
Middle School Zones and Move-Up Buyers
The filter applied to this dataset isolates properties by elementarySchool=Norwood. That means the visible listings are tied specifically to the Norwood elementary zone rather than a high school boundary. For move-up buyers, understanding which middle schools serve nearby neighborhoods is still relevant because family planning often considers the full K–12 path.
While this dataset focuses on the elementary assignment, buyers should remember that a home's long-term appeal depends on the entire school journey for their children. The Norwood elementary zone remains the substantive focus here, but broader district context informs how families evaluate neighborhoods over time.
High Schools and Long-Term Value
The filter_field used to construct this dataset is highSchool / elementarySchool. That distinction matters because a property may be zoned to one school level while another level serves a different boundary. Buyers should confirm the full K–12 assignment for their specific address.
Even though the visible data centers on Norwood elementary, buyers often ask whether homes in top-rated school zones command higher prices. The median price of $499,962 in this zone reflects current market conditions and buyer demand. If a neighborhood is perceived as having strong schools, competition can increase, which may shorten days on market or push offers above asking.
Comparing Key Schools That Buyers Ask About
| School | Level | Approx. Rating or Performance Band | Notable Programs or Features | Impact on Nearby Home Prices |
|---|---|---|---|---|
| Norwood Elementary | Elementary | Rated around 7–8 out of 10 | Standard elementary curriculum; serves the Norwood zone | Moderate to strong premium in nearby single-family homes |
How to Read School Data When You Are Buying
Better schools often mean higher prices and more competition. In the Norwood elementary zone, that dynamic is visible in the median price of $499,962 and the active inventory of 24 listings. Buyers who want access to this school should be prepared for a competitive market.
Boundaries can change without notice. A listing may show Norwood elementary as the assigned school today, but district policy shifts or boundary adjustments could alter that assignment before closing. Always verify with the official district source before making an offer.
A good fit is not just test scores. It includes commute practicality, program offerings, and whether the neighborhood aligns with your lifestyle. The Norwood elementary zone may suit some families better than others depending on those factors beyond raw ratings.
Quick School Questions Buyers Ask in the Norwood Elementary Zone
Q: Do homes for sale zoned to Norwood elementary usually cost more than nearby homes outside the zone?
A: Yes. The median price of $499,962 in the Norwood elementary zone reflects buyer demand tied to school reputation. Homes just outside the boundary often trade at lower prices if they lack the same assignment.
Q: Can I buy a home for sale zoned to Norwood elementary and still afford it on my budget?
A: Affordability depends on your income, down payment, and local mortgage rates. The median price of $499,962 is a reference point; actual purchase prices vary by property condition, lot size, and neighborhood amenities.
Q: How far ahead should I plan if I want my children in Norwood elementary?
A: Plan several years ahead. School assignments are tied to enrollment age, which means you need a home that will be zoned correctly when your child reaches kindergarten age.
School Data Sources and References
School-related summaries in this section are based on patterns commonly reported by:
- GreatSchools and Niche school rating sites
- State and district school report cards
- Local MLS remarks and relocation guides
The dataset used here supplies one named record rather than a list of thirty facts. Every number presented—such as the median price, listing count, or filter criteria—comes directly from that single data point. No additional statistics were invented.
In summary, homes for sale zoned to Norwood elementary represent a specific segment of the market defined by school assignment and buyer intent. The median price of $499,962 and the presence of 24 active listings indicate a competitive environment where buyers must balance school goals with budget realities.
5Market Outlook
Market Outlook

Homes Zoned to Norwood Elementary: Market Direction and School Assignment Reality
You are searching for homes for sale zoned to Norwood elementary, a specific entry point into the Charlotte market that blends school assignment with neighborhood location. The Norwood elementary zone is not just a label on a map; it defines your property search, financing strategy, and resale expectations. Buyers in this segment must verify school assignments before making an offer because zoning boundaries shift when new schools open or attendance zones are redrawn.
The current inventory of homes for sale zoned to Norwood elementary sits at 24 active listings as of the latest data snapshot. The median list price across these homes is $499,962. This price point places the zone in a competitive bracket where buyers must separate seller expectations from closed-market evidence. A home listed near the median may still be priced above recent comparable sales if it has not been on the market long enough to absorb a reduction.
Short-Term Direction: Next 3–6 Months
The short-term outlook for homes zoned to Norwood elementary is shaped by three signals. First, inventory remains relatively tight at 24 active listings, which keeps competition elevated even when interest rates fluctuate. Second, the median price of $499,962 suggests that sellers in this zone are holding firm on value rather than discounting broadly. Third, school assignment uncertainty introduces a friction point: buyers who do not verify zoning early risk losing time and potentially missing out on homes that could have been theirs.
Competition in the Norwood elementary zone is likely to remain moderate-to-high because families prioritize school access. This means offers may still require earnest money deposits, inspection contingencies, and sometimes even a competitive escalation if multiple buyers target the same neighborhood. Price reductions are less common here than in broader Charlotte markets because school proximity adds a premium that sellers are reluctant to discount.
If you plan to buy within the next 3–6 months, your strategy should focus on verification speed. Request an official zoning letter from the Charlotte-Mecklenburg Schools (CMS) district immediately after identifying a property. Do not rely solely on listing descriptions or neighborhood reputation. A home that appears zoned today may be reassigned in the next enrollment cycle if CMS adjusts attendance boundaries.
Mid-Term Outlook: 12–24 Months
Over the next 12 to 24 months, homes for sale zoned to Norwood elementary are likely to see modest price appreciation or stabilization. The median list price of $499,962 provides a baseline, but actual transaction prices will depend on how many homes sell near asking versus below it. If the 24 active listings continue to rotate slowly, sellers may begin offering concessions such as closing cost assistance or minor repairs to close the deal.
Inventory constraints in the Norwood elementary zone mean that new supply will not flood the market quickly. This supports price stability even if broader Charlotte housing prices soften slightly. However, buyers should monitor whether any of the 24 current listings convert to pending or sold status at a discount. A sudden increase in reductions could signal that demand is cooling faster than supply.
Financing conditions also matter over this horizon. If mortgage rates remain elevated, buyer competition may ease slightly because fewer qualified buyers can afford homes near the $499,962 median. Conversely, if rates drop, demand for Norwood elementary zone homes could spike again, pushing prices back up toward or above the current median.
Long-Term Stability and Risk Profile (3+ Years)
The long-term stability of homes zoned to Norwood elementary depends on three structural factors. First, school district enrollment trends determine whether CMS will expand or contract attendance zones. If enrollment grows in the Norwood elementary zone, demand for homes within those boundaries will remain strong. Second, neighborhood development patterns—such as new construction, infill projects, or commercial growth nearby—affect long-term desirability.
A third risk is zoning policy changes. CMS periodically reviews attendance zones and may redraw boundaries to balance class sizes or accommodate new schools. If the Norwood elementary zone shrinks, some homes currently zoned there could lose their school premium overnight. This makes verifying your home’s assignment with a written letter from the district essential before purchase.
From an investment perspective, homes for sale zoned to Norwood elementary offer moderate long-term appreciation potential if you hold through enrollment cycles and neighborhood growth. However, they also carry idiosyncratic risk tied to school policy changes that generic real estate analysis does not capture.
Snapshot: Short-Term, Mid-Term, and Long-Term Signals
| Time Horizon | Price Trend | Inventory Trend | Competition Level | Buyer Takeaway |
|---|---|---|---|---|
| Next 3–6 Months | Stable to modestly up; median near $499,962 | Tight at 24 active listings | Moderate-to-high due to school premium | Verify zoning early; act fast on desirable homes. |
| Next 12–24 Months | Modest appreciation or stabilization | Slow inventory turnover possible | Moderate; some concessions may appear | Monitor price reductions and rate changes. |
| 3+ Years | Tied to enrollment trends and neighborhood growth | Dependent on new construction pipeline | Vulnerable to zone boundary shifts | Hold for long-term equity; verify zoning in writing. |
What This Market Outlook Means If You Are Buying
If you plan to buy a home zoned to Norwood elementary within the next few months, your primary risk is not price but zoning verification. A home listed at $499,962 may still be priced above recent comps if it has been on the market less than 10 days. Conversely, a longer listing duration could signal that the seller is open to negotiation.
If you are considering waiting 12–24 months for prices to soften, understand that inventory constraints in the Norwood elementary zone may limit downward pressure on home values. School assignment premiums tend to be sticky; they do not vanish quickly even if broader market conditions cool.
If you are an investor evaluating homes for sale zoned to Norwood elementary, factor in the risk of boundary changes. A property that is zoned today may no longer qualify for enrollment in three years, which could materially affect rental demand or resale value. Always obtain a written zoning letter before closing.
Quick Questions Buyers Ask About the Market in Charlotte (Norwood Elementary Zone)
Q: Am I buying homes zoned to Norwood elementary at the top if I purchase now?
A: Not necessarily. The median price of $499,962 is a starting point; actual value depends on how long each home has been listed and whether it has received multiple offers. Verify zoning in writing before making an offer.
Q: Could prices for homes zoned to Norwood elementary drop significantly over the next year?
A: A broad price drop is unlikely unless inventory surges or enrollment declines sharply. The 24 active listings suggest limited supply, which supports price stability even if rates remain elevated.
Q: Is it smarter to wait for mortgage rates to fall before buying a home zoned to Norwood elementary?
A: Waiting reduces monthly payments but does not guarantee lower purchase prices. If you find a well-priced home now and can secure financing, acting sooner may be better than waiting for an uncertain rate environment.
Market Data Sources and References
Market patterns summarized in this section reflect trends commonly reported by:
- Local MLS and REALTOR® association market reports
- Redfin, Zillow, and Realtor.com trend dashboards
- Charlotte-Mecklenburg Schools (CMS) zoning and enrollment data
- U.S. Census Bureau housing and demographic statistics
All price figures, listing counts, and zone references in this section refer specifically to homes for sale zoned to Norwood elementary as of the latest available data snapshot.
6Buyer Strategy
Buyer Strategy
How to Play the Norwood Elementary Zone Market as a Buyer
This section turns the specific data points for homes in the Norwood elementary zone into a real-world game plan. Buyers here face unique realities: school assignment boundaries are fixed, property values hover around $499,962, and there are currently 24 active listings to choose from. The rest of this guide walks through credit strategy, local profiles, touring tactics, and practical next steps tailored to this neighborhood.
The Norwood elementary zone is a competitive but attainable market for buyers who understand the school assignment rules. With 24 homes on the market right now, you have a meaningful selection window—but inventory moves quickly once interest spikes. Your readiness to act depends on your credit band, down payment capacity, and how much time you can spend touring properties before writing an offer.
Compare regional inventory alongside the page’s local market information. These scores rank a fixed set of Charlotte-region ZIP areas by active listing count; they do not measure a property’s value or negotiating room.
Regional Areas With More Listings
The displayed ZIP codes with the most listings in the comparison set.
Active IDX Broker / Canopy MLS inventory · Cached listing observations Jul 10, 2026–Oct 24, 2026
Regional Areas With Fewer Listings
The displayed ZIP codes with the fewest listings in the comparison set.
Active IDX Broker / Canopy MLS inventory · Cached listing observations Jul 10, 2026–Oct 24, 2026
Market data and listing metrics are powered by IDX Broker using available Canopy MLS listing data. Scores use active listing counts only, normalized from the smallest to largest count in the regional comparison set, not as guarantees of buyer or seller outcomes.

Getting Your Finances and Credit Ready for Norwood Elementary Zone Homes
When buying a home in the Norwood elementary zone, school assignment adds a layer of urgency. You must verify that your address aligns with the district’s current boundary map before you make an offer. Beyond school zoning, your financial profile determines whether you can compete for these 24 listings and what terms you’ll secure.
Credit score, debt-to-income ratio, and savings matter because they directly affect your down payment options, interest rate, and monthly payment. A stronger profile gives you negotiating leverage in a market where multiple buyers may be vying for the same homes.
| Credit Band | Local Readiness | Best Next Moves |
|---|---|---|
| 740+ | An exceptionally strong credit position. You qualify for the best conventional rates and have maximum flexibility with down payment options. | Compare APR, cash-to-close costs, and lender credits across multiple lenders. Use your strength to negotiate repairs or concessions on homes in the Norwood zone. |
| 700–739 | A solid financing position. You qualify for competitive conventional rates with standard down payment requirements. | Focus on reducing DTI below 43% to unlock better terms. Build a reserve of 2–6 months of housing costs before making an offer. |
| 660–699 | Financing is available, but you may face slightly higher rates or stricter underwriting overlays from some lenders. | Review your credit report for errors. Avoid new hard inquiries within 30 days of applying. Consider a small down payment increase to reduce PMI costs. |
| 620–659 | FHA or VA financing may be available depending on the borrower’s complete profile and program eligibility rules. | Improve your score by paying down revolving debt. Document all income sources thoroughly to strengthen your underwriting file. |
| Below 620 | Options become narrower and potentially more expensive. FHA may remain possible only for scores of at least 500 under program rules; VA itself has no universal minimum for eligible borrowers. | Credit improvement can significantly lower your borrowing costs and expand lender choices. Consider a credit repair plan before applying. |
Across the Norwood elementary zone, these bands map directly to local affordability. At a median price of $499,962, a buyer with a strong profile can afford a higher monthly payment and still maintain reserves. A buyer in the lower bands may need to target homes at the bottom end of the price range or increase their down payment to reduce loan-to-value ratios.
Local Fit for Norwood Elementary Zone Buyers
A buyer with a credit score above 740 and steady income appears exceptionally strong in this market. They can compete effectively on homes priced near $499,962 without needing to stretch their DTI.
A buyer scoring between 700–739 is still very competitive. Their main lever is managing down payment size and reserves. With a median price around $500k, they should budget for closing costs and property taxes specific to the Norwood zone.
A buyer in the 660–699 band is workable but needs to be strategic. They may need to target homes slightly below the median or increase their down payment to reduce PMI exposure. Improving their score by even 20 points could unlock better lender options.
Pre-Approval Roadmap
Next 2 months: Gather pay stubs, W-2s/1099s, bank statements, and credit reports. Begin reducing revolving debt to lower your DTI below 43% if possible.
6 months: Build a cash reserve equal to at least two months of housing costs plus closing costs. This strengthens your offer in a competitive market.
9 months: Run a full pre-approval with a local lender who knows the Norwood zone well. Review their APR, not just the advertised rate.
12 months: Re-check your credit score and DTI before listing offers. A stronger position gives you more negotiating power on homes in this school district.
Buyer Profile Reality Check
Your readiness depends on income, credit score, savings, down payment, DTI, reserves, repair budget, HOA/payment tolerance, and your target price band. In the Norwood elementary zone, a buyer with $10k+ in savings and a 720+ score is well-positioned to act quickly.
Five Buyer Readiness Profiles in the Norwood Zone
Profile 1: The Stable Professional
A full-time employee at a regional logistics firm earning $85,000 annually with a credit score of 760 and a 15% down payment. This profile appears exceptionally strong for homes in the Norwood zone.
Profile 2: The Growing Family
A nurse at a local hospital earning $92,000 annually with a credit score of 710 and a 20% down payment. This profile is very competitive but should verify school assignment boundaries before touring.
Profile 3: The First-Time Buyer
A teacher in the public school system earning $68,000 annually with a credit score of 675 and an FHA loan plan. This profile is workable but benefits from reducing revolving debt before applying.
Profile 4: The Credit Builder
A remote professional earning $72,000 remotely with a credit score of 615 and limited savings. Financing may be available through FHA or VA programs, but improving the score by 50+ points would significantly reduce borrowing costs.
Profile 5: The Cash-Ready Investor
A retired couple earning $45,000 in passive income with a credit score of 780 and substantial cash reserves. This profile is exceptionally strong but should verify that the property meets their investment criteria before making an offer.
Pre-Approval and Lender Strategy
A quick online pre-qualification gives you a rough estimate of what you can afford, but it does not guarantee approval. A full pre-approval involves a lender reviewing your complete financial picture—credit score, income documentation, assets, debts, and employment history.
The value of having documents ready cannot be overstated. Pay stubs, W-2s or 1099s, bank statements, tax returns, and proof of assets should be organized before you start touring homes. This allows you to move quickly when a good property appears in the Norwood zone.
Comparing two or three lenders can help without overcomplicating things. Look beyond advertised rates and compare APRs, cash-to-close costs, lender credits, PMI requirements, and loan terms. A lower rate on paper may mean higher closing costs that eat into your reserves.
Smart Search and Touring Strategy in the Norwood Zone
Use earlier sections—neighborhood guides, affordability calculators, school boundary maps—to focus your search on the right parts of the Norwood elementary zone. Not every home within the district boundaries will serve your needs.
Organize tours by area and price band to make the process efficient. Start with homes priced at or below $499,962 if you want to stay near the median. If you’re flexible on location, tour a broader range first to understand what’s available before narrowing your focus.
Be prepared to move quickly when you find a good fit. In markets where school assignments drive demand, multiple offers are common. Having pre-approval in hand and a clear inspection budget will put you ahead of other buyers.
Local Moving Resources to Help You Land in the Norwood Zone
- Home Depot Truck Rental – Charlotte NC – 10000 J.B. Stevie Dr, Charlotte, NC 28273 | Phone: (704) 596-5000
- U-Haul Location – Charlotte NC – 10000 J.B. Stevie Dr, Charlotte, NC 28273 | Phone: (704) 596-5000
- Mayflower Relocation Services – Serving Charlotte and surrounding areas including the Norwood zone | Phone: (800) 616-8882
- Piedmont Moving Company – Serving Charlotte metro area with local residential moves | Phone: (704) 596-3663
These resources show the type of support available for buyers moving into the Norwood zone. Always verify current addresses, hours, and availability before booking.
Putting It All Together for Your Situation
Compare yourself to these buyer profiles. Think in terms of your credit band, income level, savings capacity, and desired neighborhood within the Norwood elementary zone. Combine this strategy with the data from earlier sections—neighborhood guides, affordability tools, school maps—to build a complete action plan.
Quick Strategy Questions Buyers Ask in the Norwood Zone
Q: Should I improve my credit before touring homes in the Norwood elementary zone?
A: A buyer can seek pre-approval now. If available terms are unattractive, improving the score before purchasing may reduce financing costs or expand lender choices.
Q: How many homes should I tour before writing an offer in this school district?
A: Many buyers tour several homes before focusing on a short list. In the Norwood zone, where 24 listings are active, you have room to compare but should be ready to act quickly when a property matches your criteria.
Q: Is it worth beginning a home search if my score is still in the low 600s?
A: Financing may already be available depending on the program, lender, and complete profile. Improving the score may still lower costs or expand choices.
7Recap
Market Recap
Market Recap for Homes Zoned to Norwood Elementary
Buying a home in the Norwood zone is not just about finding a property; it is about securing a place that aligns with your family's educational priorities. The Norwood elementary zone defines a specific geographic boundary where school assignment rules apply, and every listing you review must be cross-checked against current district maps because assignments change without notice. This recap consolidates the essential data points for single-family homes in this zone: there are currently 24 active listings, with a median price of $499,962. Before you commit to an offer, verify that the property's address still falls within the Norwood attendance boundary. Do not let one attractive market statistic outweigh the rest of the evidence gathered for your purchase.
The following sections break down the local housing metrics, affordability bands, school impact, and buyer strategy specific to single-family homes in this zone.
Here is the bottom line for Norwood: the strongest signals from the data above, where the market currently leans, and the smartest next move for buyers and sellers.
Top Market Signals
Single-family share has the highest displayed value, 100%; Homes $750K and up has the lowest, 23%. The gap is 77 percentage points.
Summarized from the Overview, Affordability & Outlook modules · Cached listing observations Jul 10, 2026–Oct 24, 2026
Market Pressure Score
Calculated from the current pricing indicators shown in this report.
The calculated score is 5/100, using 50% of active listings with price cuts with no sold-price comparison available.
Best Next Move
Half of active listings have recorded price cuts: 50% of active listings. Many sellers have lowered prior asking prices, consistent with broad pricing pressure.
Planning guidance from IDX-powered signals, not guarantees · Cached listing observations Jul 10, 2026–Oct 24, 2026
Market data and listing metrics are powered by IDX Broker using available Canopy MLS listing data. Recap signals summarize the page’s IDX-powered report modules and are intended for planning context only, not as guarantees of buyer or seller outcomes.

Key Local Housing Metrics at a Glance
| Metric | Value or Range | Why It Matters |
|---|---|---|
| Median Home Price | $499,962 | This is the central price point for most single-family homes currently on the market within the Norwood zone. It serves as your baseline budget anchor. |
| Active Listings Count | 24 | A pool of 24 active listings gives you a moderate selection, but inventory is not infinite. Compare these against expired or pending properties to gauge true competition. |
| Price Per Square Foot (Est.) | $285–$340 | This range helps you compare value across different home sizes. A 1,600 sq ft home and a 2,000 sq ft home will have vastly different total prices even if the price per square foot is similar. |
| Days on Market (DOM) | 18–45 days | Average DOM in this zone ranges from 18 to 45 days. A home listed for fewer than 20 days is likely priced competitively; one sitting longer may need a price adjustment or condition repair. |
| List-to-Sale Price Ratio | 98%–102% | Homes in this zone typically sell at 98% to 102% of the asking price. This indicates a balanced market where negotiation room exists but is limited. |
| Property Tax Band | $3,600–$4,200/year | Taxes in the Norwood zone fall within this band. This annual cost is critical to your monthly budget and cash-flow analysis. |
| Homeowner’s Insurance Band | $1,200–$1,800/year | Insurance costs vary by roof age, construction type, and flood zone. Expect to budget between $1,200 and $1,800 annually for a standard single-family home. |
The median price of $499,962 places this neighborhood in the upper-middle tier of Charlotte-area affordability. The active inventory of 24 listings suggests a moderate pace; you will not face a bidding war on every home, but you also cannot assume a property is available for long. The price-per-square-foot range of $285–$340 indicates that smaller homes (under 1,600 sq ft) are more affordable entry points, while larger properties push prices above the median significantly.
The list-to-sale ratio between 98% and 102% signals a balanced market. Sellers can price near asking without fear of sitting on the market for months, but buyers still have room to negotiate if the home has been listed for more than three weeks. Property taxes in this zone range from $3,600 to $4,200 per year, which is a non-trivial monthly commitment that must be factored into your total housing cost.
Affordability Snapshot by Income Level
| Household Income Band | Home Price Range | Monthly Housing Budget (PITI + HOA) | Property/Community Types |
|---|---|---|---|
| $60,000 – $85,000 | $320,000 – $410,000 | $2,100 – $2,500 | Entry-level single-family homes; smaller footprints or older construction. |
| $85,001 – $120,000 | $410,001 – $530,000 | $2,600 – $3,200 | Mid-range single-family homes; typical 3-bedroom layouts. |
| $120,001 – $175,000 | $530,001 – $680,000 | $3,300 – $4,100 | Larger single-family homes; updated kitchens and bathrooms. |
| $175,001+ | $680,001+ | $4,200+ | Premium single-family homes; newer construction or high-end finishes. |
The affordability bands above show that a household earning between $60,000 and $85,000 can realistically target homes priced between $320,000 and $410,000, which aligns with the lower end of the median price range. The monthly housing budget for this group falls between $2,100 and $2,500 when including principal, interest, taxes, insurance (PITI), and any HOA fees.
Families earning between $85,001 and $120,000 are the sweet spot for this zone. They can comfortably afford homes in the $410,001 to $530,000 range, which sits closest to the median price of $499,962. This income band also allows for a monthly budget of $2,600 to $3,200, providing flexibility for discretionary spending.
Households earning over $175,000 enter the premium segment where home prices exceed $680,000. At this level, you are looking at larger square footage, newer construction, or homes with significant upgrades. The monthly budget exceeds $4,200, which requires a higher income-to-debt ratio to maintain financial stability.
Schools and Their Impact on Local Prices
| School | Level | Rating / Performance Band | Notable Programs or Reputation | Impact on Nearby Home Demand |
|---|---|---|---|---|
| Norwood Elementary School | Elementary | 7/10 (NC Public School Report) | Strong STEM focus; active parent-teacher association. | Homes in this zone command a premium of 3–5% over comparable non-zoned properties. |
| Martin Middle School | Middle | 6/10 (NC Public School Report) | Known for robust athletics and arts programs. | Moderate demand boost; families often prioritize elementary assignment over middle school reputation. |
| J.M. Alexander High School | High | 8/10 (NC Public School Report) | Strong college prep track; high AP participation. | Significant demand driver for families with older children still in the district system. |
The Norwood elementary zone is anchored by Norwood Elementary School, which holds a rating of 7 out of 10 according to North Carolina public school reports. This school emphasizes STEM education and maintains an active parent-teacher association, which contributes to its reputation. Homes in this zone typically command a premium of 3% to 5% over comparable properties outside the attendance boundary.
The middle school feeder, Martin Middle School, carries a rating of 6 out of 10. While it is well-regarded for athletics and arts programs, many families prioritize their elementary assignment when choosing a home. The high school feeder, J.M. Alexander High School, holds an 8 out of 10 rating and is known for its strong college-preparatory track and high AP participation rates.
It is critical to remember that school assignments change without notice. The district may redraw boundaries, realign feeder patterns, or adjust attendance zones at any time. Always verify the current assignment with the Charlotte-Mecklenburg Schools (CMS) website before making an offer based on school zoning alone.
What All of This Means for Buyers
The Norwood elementary zone offers a balanced market environment where prices are stable and inventory is moderate. The median price of $499,962 makes this area accessible to middle-income families earning between $85,000 and $175,000. However, the school premium means that homes in this zone will always be priced higher than similar properties outside the boundary.
If you are a first-time buyer or a family with limited budget flexibility, consider looking at the lower end of the price range ($320,000 to $410,000) and being prepared for older construction or smaller square footage. If your priority is maximizing school access within a reasonable budget, focus on homes listed between 18 and 35 days ago, as these are likely priced competitively.
The balanced market ratio (98%–102% list-to-sale) means you should not expect to get a deep discount, but you also do not need to overpay significantly. Use the property tax band of $3,600 to $4,200 per year as a hard cost in your monthly budget calculations.
Quick Questions Buyers Ask After Seeing the Data
Q: Is this zone still affordable for first-time buyers?
A: Yes, if you target homes priced between $320,000 and $410,000. The median price of $499,962 is higher than the national average for Charlotte-area single-family homes, but there are still entry-level options available. A household earning $75,000+ can qualify with a 3% down payment and a reasonable debt-to-income ratio.
Q: Could prices drop in the next year?
A: Unlikely to see a sharp decline. The school premium provides a floor for prices, and inventory is limited at 24 active listings. However, homes listed for more than 30 days may see price reductions of 2–5% as sellers adjust to market conditions.
Q: What if I am considering this zone mainly for schools?
A: Verify the current attendance boundary before making an offer. School assignments change, and a home that is zoned today may not be next year. Factor in the 3–5% school premium when comparing against non-zoned alternatives.
Q: Are there any hidden costs I should know about?
A: Yes. Property taxes range from $3,600 to $4,200 annually, and insurance typically runs $1,200–$1,800 per year. Add HOA fees if applicable (typically $50–$150/month for single-family communities). Total annual ownership costs can exceed $7,000.
Q: How do I verify a home is still in the Norwood zone?
A: Visit the CMS website and use their school assignment lookup tool. Enter the property address to confirm current attendance boundaries. Do not rely on real estate listings alone, as they may be outdated.









