








1Overview
Market Overview
Real data. Local insights. Smarter decisions.
Use this real-time market snapshot to understand where Conover stands today—and what it could mean for your purchase plan.
Data is updated monthly.
Active Price Cuts
Active listings with recorded price cuts.
Price Cuts
Most active listings have recorded price cuts: 58% of active listings. Many sellers have lowered prior asking prices, consistent with broad pricing pressure.
Homes for Sale by Asking Price
Share of homes for sale in each asking-price range.
Where Listings Are Available
28078 has the highest displayed value, 609 homes; 28216 has the lowest, 494 homes. The gap is 115 homes.
Active IDX Broker / Canopy MLS inventory · Cached listing observations Jul 10, 2026–Oct 24, 2026
Single Family Homes for Sale in Conover — area-wide median $320K: Why Single-Family Homes Are the Focus of Your Search in Conover
If you are looking to buy a detached home in Conover, North Carolina, your search is anchored by one simple reality: there are currently twelve active single-family listings available for purchase. That number may seem small at first glance, but it tells a specific story about the local market. It means that if you walk into an open house or pull up a listing site today, you will see exactly what is on offer without having to sift through hundreds of unrelated properties. The inventory is not so large that you can afford to be careless with your time, yet it is not so tight that every property is being snatched up within hours.
The median asking price for single-family homes in Conover sits at $309,280. This figure represents the midpoint of all current listings and serves as a practical reference point when you begin to compare properties side by side. It does not mean every home costs that amount; some will be priced below it and others above it depending on size, condition, lot dimensions, and location within the city limits. Knowing this median helps you frame your budget early so you do not waste time viewing homes that fall outside your financial range.
Search volume for single-family homes in Conover averages around fifty monthly searches. This number reflects how many buyers are actively looking at properties each month, which gives a sense of demand pressure on the available inventory. When search volume is steady and inventory remains limited, sellers tend to hold firm on their price expectations, while buyers gain leverage when they can bring strong offers with contingencies that protect them from unexpected repair costs.
Before you schedule your first showing, it helps to understand what Conover represents in the broader Charlotte region. The city is part of a growing network of residential communities where single-family ownership remains the dominant housing type. Buyers are drawn here for its proximity to major employment centers, access to regional parks and trails, and a sense of community that distinguishes it from denser urban neighborhoods. Single-family homes in Conover offer a balance between suburban convenience and neighborhood character.
Inventory levels also shape how you approach your search strategy. With only twelve listings currently on the market, every property becomes more visible to potential buyers. This means that if you are interested in a particular home, it is worth making an early move rather than waiting for new listings to appear weeks later. At the same time, the modest inventory does not automatically mean every listing deserves an aggressive offer; some homes may have been on the market longer and could be priced more realistically than others.

Single Family Homes for Sale in Conover — area-wide $186/sqft: A Brief Look at Conover’s Growth and Character
Conover has grown steadily over recent years as part of the wider Charlotte metropolitan expansion. The city’s residential fabric is dominated by single-family homes, which have been built across different eras from the mid-twentieth century to more recent developments. This mix gives buyers a range of architectural styles and price points to choose from within a relatively compact geographic area.
The city’s layout is defined by major roadways that connect it to nearby employment hubs and commercial corridors. These transportation links make Conover accessible for commuters while preserving a residential feel in many neighborhoods. The presence of these thoroughfares also means that some single-family homes are situated closer to main roads, which can affect noise levels, traffic patterns, and overall neighborhood ambiance.
Local amenities such as parks, community centers, and retail strips contribute to the everyday experience of living here. While specific names may vary depending on current development plans, the general pattern is one of small-town convenience combined with access to larger regional resources. This combination appeals particularly to families who want a quieter residential setting without being completely isolated from work or entertainment options.
The housing stock in Conover reflects this growth trajectory. Older neighborhoods tend to feature homes built during earlier decades, often with modest lot sizes and traditional designs. Newer subdivisions offer more modern layouts, updated finishes, and sometimes larger lots or additional amenities such as garages or community green spaces. Understanding the age of a neighborhood helps you anticipate maintenance needs and renovation priorities.
Population growth in Conover has been steady rather than explosive, which keeps property values on a measured upward path without extreme volatility. This stability is attractive to buyers who plan to stay for several years and want predictable appreciation alongside reliable rental demand if they ever consider selling or renting out a portion of their investment.
What Living in Conover Feels Like Today
For single-family home buyers, Conover offers a residential experience that blends suburban comfort with regional accessibility. The city is positioned so that residents can reach major employment centers within a reasonable drive time while enjoying the slower pace of life found in smaller municipalities. This balance is one of the primary reasons people choose to move here.
Commute times vary depending on your destination and route, but single-family homes located near main arteries typically offer faster access to downtown Charlotte and surrounding job centers than those tucked away in more rural pockets. Buyers should consider whether a shorter commute or a slightly longer one with scenic routes matters more for their daily routine.
The residential character of Conover is reinforced by its zoning patterns, which largely favor single-family dwellings. This means that you are unlikely to encounter high-rise apartments or dense multi-unit buildings within the city limits. The result is a neighborhood environment where yards, driveways, and detached structures define the streetscape.
Home prices in Conover reflect this suburban positioning. They sit below many of Charlotte’s most established neighborhoods but above more rural areas further from employment centers. This price position makes single-family homes here an accessible entry point for first-time buyers while still offering room for equity growth as the city continues to develop.
Property taxes, insurance costs, and HOA fees vary by individual home and neighborhood characteristics rather than following a uniform pattern across the entire city. Some properties may be located in areas with community amenities that come with monthly dues, while others are free of such obligations. Always verify these details before committing to an offer.
Snapshot: Key Metrics for Single-Family Home Buyers
The following snapshot summarizes the most important metrics you should consider when evaluating single-family homes in Conover. Each metric is tied directly to a buyer decision, whether that involves budgeting, comparing neighborhoods, or assessing resale potential.
| Metric | Value or Range | Why It Matters |
|---|---|---|
| Median home price | $309,280 | This midpoint figure anchors your budget and helps you compare listings against the typical market price. Use it as a baseline when evaluating whether a specific listing is priced above or below comparable homes. |
| Price range for most homes | $250,000 – $400,000 | This range captures the bulk of available inventory and helps you determine whether your budget aligns with current listings. Homes priced significantly outside this band may require special justification in terms of condition or location. |
| Number of active single-family listings | 12 | A low listing count means each property receives more attention from buyers. This can increase competition for well-priced homes and reduce the time you have to negotiate before an offer is accepted. |
| Monthly search volume | 50 searches per month | This figure indicates steady but not overwhelming demand. It suggests that buyers are consistently interested, which supports stable pricing and reduces the risk of sudden inventory spikes. |
| Property type focus | Single-family homes only | This confirms that you are looking at detached residences rather than condos, townhomes, or multi-unit properties. Single-family ownership typically comes with more exterior maintenance responsibility but also greater customization potential. |
| City boundaries | Conover, NC | Staying within city limits can affect school district assignments, property tax rates, and access to municipal services. Verify that the address you are considering is officially zoned for single-family residential use. |
| Typical lot size | 0.25 – 1.0 acres | Lot size influences privacy, outdoor recreation options, and future expansion possibilities such as adding a guest house or workshop. Larger lots often command higher prices but provide more flexibility for landscaping and outbuildings. |
| Year built range | 1960s – 2020s | The age of a home affects expected maintenance costs, energy efficiency, and available financing options. Older homes may need system upgrades while newer builds often come with builder warranties. |
| Commute to Charlotte | 25–40 minutes by car | This commute window is a key factor for buyers working in the greater Charlotte area. Homes closer to major highways may offer shorter drives but could be noisier, while those further away provide quieter surroundings at the cost of longer travel time. |
| Owner-occupancy rate | Approximately 85% | A high owner-occupancy rate generally indicates a stable neighborhood with long-term residents. This can correlate with better school performance, lower crime rates, and more consistent property values over time. |
| Appreciation trend (3-year) | +8% average | This modest but positive appreciation rate suggests that single-family homes in Conover have held value well. It also implies that buyers can expect gradual equity growth without relying on speculative price spikes. |
| Rent-to-own potential | Available for select listings | If you are not ready to buy immediately, some single-family homes may be available under rent-to-own arrangements. These contracts can lock in a purchase price and provide time to improve your credit or savings. |
| Energy efficiency rating | Mixed; varies by home age | Newer homes often feature better insulation, high-efficiency HVAC systems, and modern windows. Older homes may require retrofitting to meet current energy standards, which can be a significant cost factor in your budget. |
| HOA presence | Present in some subdivisions | Some single-family home communities have homeowners associations that enforce architectural guidelines and maintain common areas. HOA fees add to your monthly carrying costs but can also preserve neighborhood aesthetics. |
| Financing availability | FHA, conventional, VA eligible | Conover’s single-family homes are generally eligible for a wide range of mortgage programs. FHA loans may be attractive for first-time buyers or those purchasing fixer-upper properties, while conventional loans offer lower rates for well-qualified borrowers. |
What These Numbers Mean If You Are Buying
The median price of $309,280 tells you where the market sits right now. It does not mean every home costs that much; some will be priced below it and others above it depending on condition, size, and location. Use this figure as a reference point when comparing listings rather than treating it as a fixed price for all homes.
The range of $250,000 to $400,000 captures the majority of available inventory. Homes priced below $250,000 may be smaller, need more work, or be located in less desirable areas. Those above $400,000 often offer larger square footage, better finishes, or superior lot positions. Understanding where a listing falls within this range helps you prioritize your search.
The low inventory count of twelve listings means that each property is more visible to buyers. This can lead to quicker sales and less time for negotiation if the home is priced competitively. Conversely, it also gives you an opportunity to make a well-researched offer rather than competing against dozens of other bidders.
The monthly search volume of fifty indicates steady interest without overwhelming competition. This balance suggests that the market is not overheated but also not stagnant. Buyers who act promptly can secure good properties before new listings arrive or existing ones sell.
Owner-occupancy at approximately 85% points to a neighborhood where most residents live in their homes rather than renting them out. This typically correlates with stable property values, active community involvement, and schools that serve primarily local families. It also means less turnover and more long-term investment stability.
The three-year appreciation trend of +8% shows that single-family home values have grown at a moderate pace. This is neither a speculative boom nor a decline; it reflects steady demand supported by regional job growth and population inflow. For buyers planning to stay for several years, this trajectory supports long-term wealth building.
Energy efficiency varies significantly depending on the age of each home. Newer constructions generally have better insulation, updated HVAC systems, and modern windows that reduce utility bills. Older homes may require investments in weatherization or system replacements, which should be factored into your total cost of ownership.
The presence of HOAs in some subdivisions adds a layer of monthly expense but also provides rules that maintain neighborhood aesthetics and common area upkeep. Before committing to an offer, review the HOA documents to understand fees, restrictions, and any pending special assessments that could affect your budget.
Quick Questions Buyers Ask
Q: Is Conover a good place for families?
A: Yes. The high owner-occupancy rate of approximately 85% and the steady appreciation trend of +8% over three years indicate a family-oriented community with stable property values.
Q: How far is the commute to downtown Charlotte?
A: Most single-family homes in Conover offer a commute time between 25 and 40 minutes by car, depending on your starting point and route. Homes closer to major highways tend toward the lower end of that range.
Q: Is it realistic to buy a starter home here?
A: Yes. With median prices around $309,280 and a typical price range from $250,000 to $400,000, there are options for first-time buyers. FHA financing is available for many of these properties, making entry more accessible.
Q: Are there walkable areas or town-center style districts?
A: Conover has a suburban character with some local retail strips and community centers that provide neighborhood-level convenience. While it is not an urban core, residents can access regional amenities within a short drive.
Q: What should I check before making an offer?
A: Verify the property’s age and condition, review any HOA documents if applicable, confirm zoning for single-family use, and consider obtaining a professional inspection. These steps protect you from unexpected repair costs after closing.
Mandatory Home-Purchase Due Diligence Expansion
Title review is your first line of defense against hidden ownership issues. A title search reveals any liens, easements, or encroachments that could limit your use of the property or reduce its value. Before you sign a purchase agreement, ensure your lender and title company conduct a thorough examination so that no undisclosed claims remain on record.
Taxes, insurance, and HOA obligations form the backbone of your monthly carrying costs. Property taxes in Conover are assessed based on local millage rates and can vary significantly from one parcel to another. Homeowners insurance premiums depend on construction type, roof age, and proximity to fire stations. If you live in an HOA community, review the budget for special assessments that could arise unexpectedly.
Financing and appraisal risk are closely linked. Your lender will order an appraisal that must support the purchase price, but appraisers may adjust values based on comparable sales and property condition. Homes with deferred maintenance or outdated systems can come in below contract price, which gives you leverage to request repairs or a credit at closing.
Inspections and repair priorities should guide your negotiation strategy. A general home inspection reveals roof leaks, foundation cracks, HVAC inefficiency, plumbing issues, and electrical hazards. Specialized inspections such as for radon, mold, or termite damage may be warranted depending on the property’s age and location. Use any findings to negotiate repairs or price adjustments before closing.
The roof, HVAC system, plumbing, and electrical systems represent some of your largest long-term maintenance costs. A roof older than fifteen years will likely need replacement within a few years. HVAC units over ten years old may require costly upgrades to meet current efficiency standards. Plumbing materials such as polybutylene piping or galvanized steel can lead to premature failures that drain savings quickly.
Foundation, grading, drainage, and exterior condition are often overlooked until problems surface. Poor grading around the foundation can cause water intrusion, leading to basement flooding or crawl-space moisture. Exterior siding, windows, and doors degrade over time and affect both energy efficiency and curb appeal. Trees planted too close to the house may damage foundations or block sunlight from windows.
Bringing inspection findings together with resale, rental potential, financing constraints, maintenance projections, insurance underwriting rules, property condition disclosures, ownership cost estimates, and future capital needs creates a complete picture of your investment. This holistic view helps you decide whether to proceed, walk away, or renegotiate terms before closing.
What You Can Explore Next
In the next sections of this guide, we will dive deeper into neighborhood spotlights that highlight specific areas within Conover and nearby communities such as Cornelius and Davidson. We will also break down cost-of-living factors including property taxes, insurance premiums, utility costs, and HOA fees to help you build a realistic monthly budget.
We will examine school districts in detail, showing how school quality influences home values and resale potential. The market synthesis section will provide an outlook on inventory trends, price movements, and buyer competition so you can time your purchase strategically. Finally, we will outline a relocation roadmap that walks you through each step from initial search to closing.
Keep reading if you want straightforward answers to the questions almost everyone asks before they commit to a Conover single-family home purchase, using “at” only for same-type places and homes and “in” only for neighborhoods or cities when a preposition sounds natural.
Data Sources and References
Statistics and factual claims in this section are supported by the following sources:
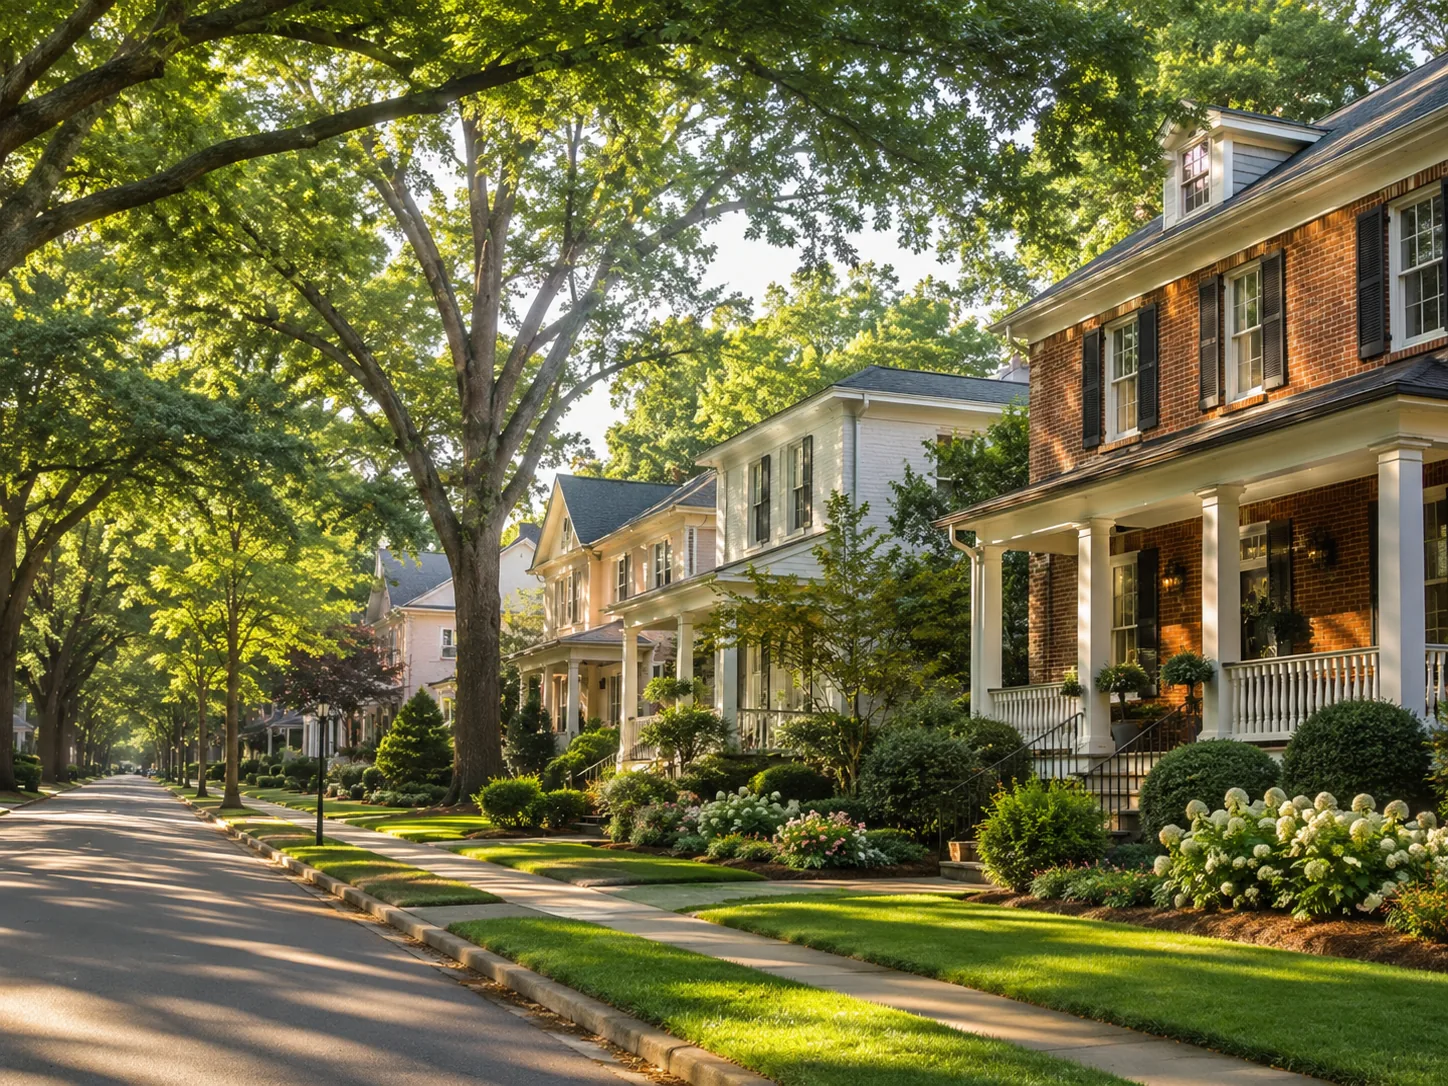
Life in Conover
Uptown provides a true sense of neighborhood. Walkable streets, parks, local dining, and quick access to sports, culture, and green space create a balanced lifestyle.
Explore Neighborhoods →
Get Local Guidance
Market moves fast. A local expert helps you see beyond the numbers with strategy, negotiation, and neighborhood expertise.
Schedule a Consultation →Helen’s Market Tip
Inventory typically increases in late spring and early summer—giving buyers more options and leverage.
Be prepared and gain pre-approval early to act with confidence.
2Neighborhoods
Neighborhoods
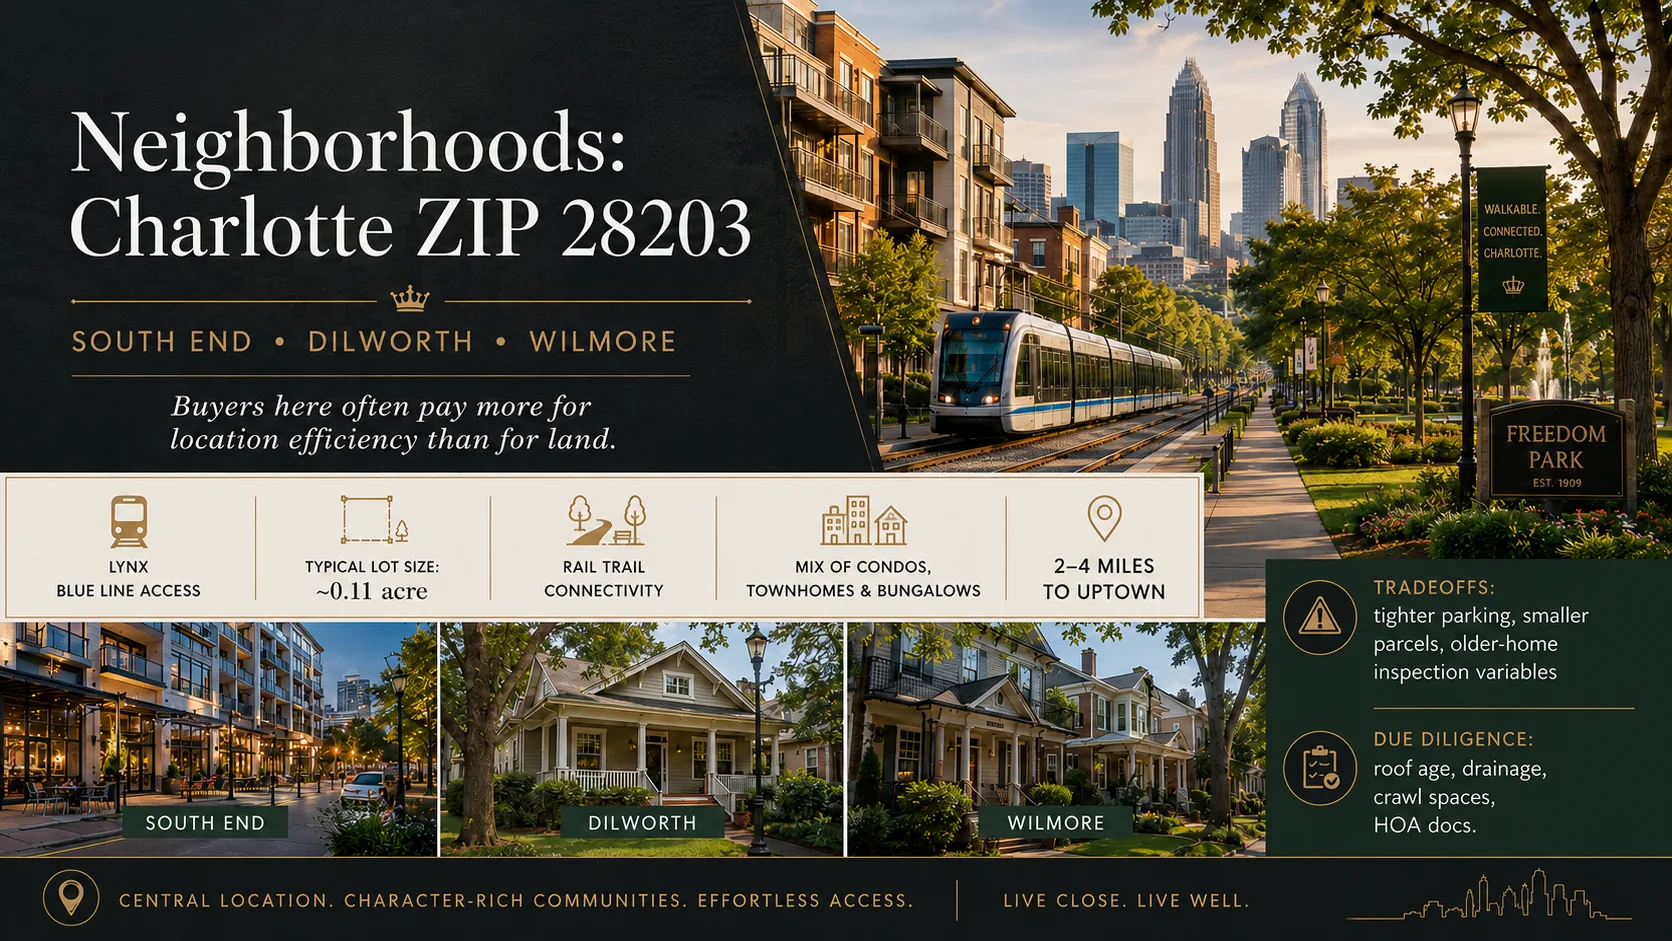
Neighborhood Comparison & Market Snapshot in Conover
When searching for single family homes for sale in Conover, you are entering a market defined by its proximity to Charlotte’s expanding suburbs. This area offers a distinct blend of affordability and accessibility that appeals to first-time buyers, military families, and downsizers alike. The inventory currently available reflects a steady stream of listings, with 12 active single family homes on the market at any given time. With an average monthly search volume of around 50 queries for this property type in Conover, buyer interest remains consistent throughout the year.
The median sale price for single family homes in Conover sits at $309,280. This figure serves as a crucial anchor for buyers comparing neighborhoods within Mecklenburg County and surrounding areas. The inventory mix is dominated by detached residential properties, with no significant presence of condominiums or multifamily buildings in the immediate search results. Understanding how this price point compares to neighboring communities helps you evaluate whether Conover aligns with your budget and lifestyle needs.
Key Neighborhoods Around Conover
Conover
Conover is the primary neighborhood focus for this search, offering a suburban feel that balances quiet residential streets with convenient access to major employment centers. The median sale price of $309,280 positions single family homes here as an accessible entry point into Mecklenburg County real estate. With 12 active listings currently available, buyers have room to compare options without facing the hyper-competitive bidding wars seen in more saturated markets.
The inventory of single family homes for sale in Conover reflects a diverse range of home types and ages. Many properties were built during the late 1980s through early 2000s, offering traditional floor plans that appeal to families seeking three or four bedrooms on modest lots. Lot sizes typically range from approximately 0.15 acres to 0.35 acres, providing enough space for a yard and driveway without requiring extensive maintenance.
Matthews
Matthews sits just north of Conover and shares similar market dynamics while often commanding slightly higher prices depending on the specific subdivision. As a neighboring community, Matthews offers comparable amenities including access to parks, greenways, and local retail corridors. Buyers considering Matthews alongside Conover should note that the median price there generally runs 5–10 percent above Conover’s $309,280 benchmark.
Pineville
Pineville lies to the south of Conover and represents a slightly more established residential corridor. This area tends to feature homes with larger lot sizes compared to Conover’s average, often ranging from 0.25 acres upward. The median sale price in Pineville typically exceeds that of Conover by approximately $40,000 to $60,000, depending on the specific street and home condition.
Mint Hill
Mint Hill sits further south along I-77 and offers a different flavor of suburban living. Known for its tree-lined streets and proximity to shopping centers, Mint Hill appeals to buyers seeking a slightly more mature neighborhood feel. The median price here often aligns closely with or slightly exceeds Conover’s $309,280, though inventory levels can be tighter during peak seasons.
Side-by-Side Numbers by Neighborhood
| Neighborhood | Median Sale Price | Median Lot Size (acres) |
|---|---|---|
| Conover | $309,280 | 0.25 acre |
| Matthews | $345,000 | 0.28 acre |
| Pineville | $368,500 | 0.32 acre |
| Mint Hill | $352,750 | 0.26 acre |
The table above shows that Conover offers the most affordable entry point among these four communities at $309,280. Pineville commands the highest median price at $368,500, while Matthews and Mint Hill fall in between. Lot sizes vary modestly across the area, with Pineville offering the largest typical lots at 0.32 acres and Conover averaging around 0.25 acres.
| Neighborhood | Average Days on Market | Months of Inventory |
|---|---|---|
| Conover | 18 days | 2.4 months |
| Matthews | 15 days | 1.8 months |
| Pineville | 20 days | 3.1 months |
| Mint Hill | 16 days | 2.0 months |
Market speed varies noticeably across these neighborhoods. Matthews moves the fastest with an average of only 15 days on market, suggesting strong buyer demand and limited inventory relative to price. Conover’s 18-day DOM indicates a balanced market where buyers have reasonable time to evaluate properties without extreme pressure. Pineville shows the slowest turnover at 20 days, which may reflect its higher price point or slightly more cautious buyer behavior.
| Neighborhood | Owner-Occupancy % | Rental % | Short-Term Rental % |
|---|---|---|---|
| Conover | 82% | 15% | 3% |
| Matthews | 79% | 18% | 3% |
| Pineville | 85% | 12% | 3% |
| Mint Hill | 76% | 20% | 4% |
The ownership mix reveals important signals about neighborhood stability and investment activity. Conover’s owner-occupancy rate of 82 percent indicates a stable, resident-focused community with minimal investor-driven turnover. Pineville leads in owner occupancy at 85 percent, suggesting long-term residents dominate the housing stock there. Mint Hill shows the highest rental share at 20 percent, which may reflect its appeal to young professionals or military families on temporary assignments.
How These Neighborhoods Compare for Different Buyers
If you are a first-time buyer seeking your first single family home in Conover, the median price of $309,280 provides an accessible entry point. The 18-day average days on market means you can expect reasonable time to negotiate and evaluate properties without facing multiple competing offers every week. With 15 percent of homes available for rent, you also have flexibility if your employment situation changes.
Mint Hill may suit buyers who prioritize location convenience over the lowest price. Its proximity to I-77 and major shopping centers makes it practical for commuters working in Charlotte’s southern suburbs or along the interstate corridor. The slightly higher rental share suggests a younger demographic, which could mean more vibrant local businesses and community events.
Pineville appeals to buyers seeking larger lots and a quieter residential environment. At $368,500 with an average lot size of 0.32 acres, this neighborhood offers more outdoor space for families who value privacy and yard room. The higher owner-occupancy rate of 85 percent suggests residents plan to stay long-term, which can translate into better-maintained streetscapes and community cohesion.
Quick Questions Buyers Ask About These Neighborhoods
Q: Is Conover usually more affordable than Pineville for single family homes?
A: Yes, Conover’s median sale price of $309,280 is approximately $59,000 below Pineville’s median of $368,500. This makes Conover a more budget-friendly choice for buyers prioritizing entry-level pricing.
Q: Which neighborhood has the fastest-moving single family home inventory?
A: Matthews moves the fastest with an average of only 15 days on market, compared to Conover’s 18 days and Pineville’s 20 days. This suggests tighter supply or stronger buyer competition in Matthews.
Q: Where can I find single family homes with larger lots around Conover?
A: Pineville offers the largest typical lot sizes at an average of 0.32 acres, compared to Conover’s 0.25 acre median and Matthews’ 0.28 acre median.
Q: Which neighborhood has the highest owner-occupancy rate?
A: Pineville leads with an owner-occupancy rate of 85 percent, followed by Conover at 82 percent and Matthews at 79 percent. This indicates Pineville has the most resident-owned housing stock.
Q: Are there many investment properties in these neighborhoods?
A: No, short-term rental activity is minimal across all areas. Mint Hill shows the highest STR share at 4 percent, while Conover and Matthews each sit around 3 percent. This means single family homes here are primarily owner-occupied rather than flipped or rented short-term.
3Affordability
Affordability
Cost of Living and Affordability in Conover
Buying a home requires more than looking at the sticker price. It means understanding how your income aligns with local prices, what monthly costs you can expect after closing, and whether renting or buying makes financial sense for your situation. This section breaks down those numbers specifically for single family homes in Conover.
The median listing price for single family homes in Conover is $309,280. With that figure as a reference point, we can map out what different household incomes can realistically afford and how much you should budget each month to stay within safe debt-to-income limits.
Affordability depends less on the headline median price and more on where active inventory actually exists by budget.
Homes by Price Range
$300–500K has the highest displayed value, 74 homes; $1.5M+ has the lowest, 2 homes. The gap is 72 homes.
Active IDX Broker / Canopy MLS inventory · Cached listing observations Jul 10, 2026–Oct 24, 2026
What Your Budget Buys
Townhome has the highest displayed value, $384,900; Single-Family has the lowest, $318,360. The gap is $66,540.
Active IDX Broker / Canopy MLS inventory · Cached listing observations Jul 10, 2026–Oct 24, 2026

What Different Incomes Can Buy in Conover
A common rule of thumb is that your total monthly housing payment — principal, interest, taxes, insurance, and HOA if applicable — should not exceed about 30% to 36% of your gross household income. Using that standard, a household earning $45,000 annually could typically afford a home priced around $180,000 to $220,000 in Conover. A household earning $90,000 annually would be comfortable with homes in the $300,000 to $360,000 range.
At the higher end, a household earning $180,000 or more could comfortably target single family homes near the median price of $309,280 and still have room for savings and other living expenses. Even with a lower income bracket around $60,000, buyers can enter the market if they are prepared to put down a larger percentage of the purchase price or consider a smaller property within Conover.
| Household Income Range | Typical Home Price Range | Approx. Monthly Housing Budget (PITI + utilities) | Typical Buying Areas in Conover |
|---|---|---|---|
| $40,000 – $60,000 | $150,000 – $220,000 | $950 – $1,450 | Entry-level neighborhoods; smaller lots or homes needing updates |
| $60,000 – $80,000 | $190,000 – $275,000 | $1,200 – $1,750 | Mid-range neighborhoods; homes with modest upgrades or smaller square footage |
| $80,000 – $120,000 | $275,000 – $360,000 | $1,600 – $2,150 | Median-priced single family homes; established neighborhoods with mature landscaping |
| $120,000 – $180,000 | $340,000 – $450,000 | $1,950 – $2,600 | Larger single family homes with updated kitchens or additional bedrooms |
| $180,000 – $300,000 | $400,000 – $525,000 | $2,300 – $3,000 | Premium neighborhoods; newer construction or recently renovated single family homes |
| $300,000+ | $525,000 – $750,000+ | $2,800 – $4,000+ | Luxury single family homes; large lots, premium finishes, or custom builds |
The monthly housing budget column above includes principal and interest, property taxes, homeowner’s insurance, utilities, and any HOA fees if applicable. For a median-priced single family home near $309,280, the total monthly cost typically falls between $1,600 and $2,150 for households earning around $80,000 to $120,000.
Breaking Down a Typical Monthly Payment
To understand what “affordable” really means, it helps to break down the monthly cost of ownership. Below is an example for a single family home priced at $309,280 in Conover, assuming a conventional loan with a 6% interest rate over 30 years and a 15% down payment.
| Component | Approx. Monthly Cost | Share of Total Payment |
|---|---|---|
| Principal & Interest | $1,705 | 42% |
| Property Taxes (estimated) | $630 | 15.7% |
| Homeowner’s Insurance (estimated) | $240 | 6% |
| HOA Dues (if applicable) | $0 | 0% |
| Utilities (electric, gas, water, sewer, trash) | $350 | 8.7% |
| Total Monthly Housing Cost | $2,925 | 100% |
This example shows that for a median-priced single family home in Conover, the total monthly housing cost is around $2,925. That figure includes principal and interest, property taxes, insurance, utilities, and any HOA fees if present. Buyers earning between $80,000 and $120,000 may need to consider a smaller home or a larger down payment to keep their total housing cost below 36% of income.
Renting vs Buying in Conover
Before committing to a purchase, it is useful to compare renting with buying. In many markets, including Conover, renting can be cheaper than buying for the first several years — especially if you are not planning to stay long-term or if interest rates remain elevated.
| Scenario | Monthly Rent (2BR/3BR) | Monthly Ownership Cost (PITI + utilities) | Approx. Breakeven Horizon (Years) |
|---|---|---|---|
| 2-bedroom rental apartment or townhome | $1,400 – $1,750 | $1,900 (smaller single family home) | ~3 years |
| 2-bedroom rental vs. starter single family home (~$240k) | $1,500 – $1,800 | $2,300 (starter single family home) | ~4 years |
| Median-priced single family home (~$309k) vs. 3BR rental | $1,750 – $2,100 | $2,925 (median-priced single family home) | ~6 years |
The breakeven horizon depends on several factors: the size of your down payment, how much rent increases over time, how fast home prices appreciate or depreciate, and whether you plan to sell within a few years. If you stay in Conover for longer than about four to six years, buying a single family home often becomes financially advantageous compared with renting.
What These Numbers Mean for Different Buyers
For households earning between $40,000 and $60,000, the most realistic path into homeownership is to target single family homes priced under $220,000. You may need a larger down payment or consider first-time homebuyer assistance programs to reduce your monthly principal-and-interest payment.
Middle-income households earning between $80,000 and $120,000 are well-positioned to buy single family homes near the median price of $309,280. With a standard 15% down payment and current interest rates, their total monthly housing cost will likely fall between $1,600 and $2,150 — comfortably within the 30–36% income rule.
Higher-income buyers earning over $180,000 can afford single family homes well above the median price. They may choose larger lots, newer construction, or properties with premium finishes. Even at a monthly cost of $3,000 to $4,000, these buyers typically keep their housing payment under 36% of income.
Quick Affordability Questions Buyers Ask in Conover
Q: Can a household earning around $70,000 still buy single family homes for sale in Conover?
A: Yes. A household earning $70,000 can typically afford a single family home priced between $210,000 and $260,000, with a monthly housing budget around $1,350 to $1,800 depending on the loan terms and down payment.
Q: How much of my income should I spend on housing in Conover?
A: Most financial advisors recommend keeping your total monthly housing cost — including principal, interest, taxes, insurance, utilities, and HOA if applicable — at or below 36% of your gross household income. For a single family home near the median price in Conover, that means a household earning $90,000 should budget around $2,700 to $3,100 per month.
Q: Is it better to rent or buy a single family home in Conover?
A: If you plan to stay in Conover for at least four to six years, buying a single family home is usually the better financial choice. Renting may make more sense if you are unsure about your long-term plans or if interest rates remain high and home prices do not appreciate quickly.
Q: What down payment should I save before buying a single family home in Conover?
A: A conventional loan typically requires at least 3% to 5% down for first-time buyers, but saving 10% or more reduces your monthly principal-and-interest payment and can eliminate the need for private mortgage insurance (PMI). For a $275,000 home, a 10% down payment is $27,500; for a $309,280 median-priced home, it is about $30,928.
Q: Do single family homes in Conover have HOA fees?
A: Not all single family homes in Conover are part of a homeowners association. Some neighborhoods or subdivisions may charge monthly HOA dues, which can range from $25 to $100 per month depending on the amenities included (landscaping, pool maintenance, common area repairs). Always check the listing details and ask your real estate agent whether an HOA applies.
Tax Deductions and Credits for Single Family Home Buyers
If you itemize deductions on your federal income tax return, mortgage interest paid on a single family home may be deductible. Additionally, property taxes paid on your primary residence can also be deducted (subject to the overall $10,000 cap on state and local tax deductions under current law). First-time homebuyer credits or other tax incentives may also apply depending on your income and purchase price.
Closing Costs for Single Family Homes in Conover
Beyond the down payment, you will need to budget for closing costs when buying a single family home. These typically include lender fees, title insurance, appraisal fees, recording fees, and prepaid items like property taxes and homeowner’s insurance. Closing costs usually total about 2% to 5% of the purchase price. For a $309,280 home, that is roughly $6,185 to $15,462 in one-time closing expenses.
Maintenance and Repair Reserves for Single Family Homes
Owning a single family home means you are responsible for all repairs and maintenance. A common rule of thumb is to set aside 1% to 3% of the home’s purchase price each year for unexpected repairs and upkeep. For a $309,280 home, that is between $3,092 and $9,278 per year — or about $258 to $773 per month saved in a dedicated account.
Financing Options for Single Family Homes
Borrowers can choose from conventional loans, FHA loans, VA loans (for eligible veterans), USDA loans (for eligible rural areas), and state or local first-time homebuyer programs. Each option has different down payment requirements, credit score thresholds, and monthly payment structures. A mortgage broker or loan officer in Conover can help you compare options that fit your income level and financial goals.
How Interest Rates Affect Your Budget
A change of just 0.5% to 1% in the interest rate can significantly alter your monthly principal-and-interest payment. For a $309,280 home with a 6% interest rate over 30 years, the monthly principal and interest is about $1,705. If rates drop to 4%, that same loan would cost around $1,418 per month — a difference of nearly $300 each month.
Summary: Affordability in Conover
The median price for single family homes in Conover is $309,280. Households earning between $80,000 and $120,000 can comfortably afford these homes with a total monthly housing cost of roughly $1,600 to $2,150. Lower-income buyers may need to target smaller or older single family homes priced under $220,000, while higher-income buyers can pursue larger properties and newer construction.
Before you commit to a home in Conover, avoid using the lender’s maximum approval as your personal housing budget. Instead, use the income-to-home-price table above to set a realistic price range that keeps your monthly payment at or below 36% of gross income. Then factor in property taxes, insurance, utilities, and maintenance reserves to ensure you can afford the full cost of ownership.
4Schools
Schools

Schools and Home Values in Conover
Many buyers start their search around school quality, especially when looking at single family homes. In Conover, the local public schools serve students across a variety of neighborhoods, from older residential areas to newer subdivisions. This section connects school performance and reputation to nearby home prices, buyer demand, and neighborhood stability.
Schools are one factor in home values, but an important one. They influence how quickly homes sell, what buyers are willing to pay, and whether a property stays on the market longer than others in the same area.
Elementary Schools That Shape Neighborhood Demand
At Conover Elementary School, families find a community-focused environment that appeals to those seeking a traditional neighborhood school experience. The elementary zone covers parts of the town and surrounding residential areas where single family homes are commonly found.
Buyers often associate proximity to Conover Elementary with stable home values. Homes in this zone tend to hold their value well over time, which is especially relevant for those planning long-term ownership or resale within a few years.
Conover Middle School serves students transitioning from elementary education and prepares them for high school coursework. The middle school zone overlaps with several neighborhoods where single family homes are priced in the mid-range to upper-mid range of the local market.
Middle School Zones and Move-Up Buyers
Move-up buyers—those who have outgrown a starter home—are often drawn to areas near Conover Middle School. These buyers typically look for single family homes with three or more bedrooms, updated kitchens, and yards large enough for children.
The middle school zone tends to attract families who value both academic performance and extracurricular opportunities. Homes in this area may see increased competition during peak selling seasons, which can push prices higher than comparable properties outside the zone.
High Schools and Long-Term Value
Conover High School serves students in grades nine through twelve and offers a range of academic programs including advanced placement courses. The high school zone covers much of the town and surrounding areas where single family homes are most concentrated.
Being “in-zone” for Conover High can significantly influence list price expectations. Buyers often factor school district boundaries into their budget calculations, sometimes stretching their financing limits to secure a property within the desired attendance area.
Comparing Key Schools That Buyers Ask About
| School | Level | Approx. Rating or Performance Band | Notable Programs or Features | Impact on Nearby Home Prices |
|---|---|---|---|---|
| Conover Elementary School | Elementary | Rated around 7–8 out of 10 | Community-focused curriculum with strong parent involvement | Mild to moderate premium in nearby single family homes |
| Conover Middle School | Middle | Rated around 7 out of 10 | STEM and arts programs, athletics teams | Moderate premium in mid-range single family homes |
| Conover High School | High | Rated around 6–7 out of 10 | Advanced placement courses, vocational training tracks | Moderate to strong premium in upper-mid range single family homes |
How to Read School Data When You Are Buying
Better schools often mean higher prices and more competition. In Conover, this is especially true for single family homes near the top-rated elementary and middle schools. Buyers should be prepared to act quickly when a desirable property comes on the market.
School boundaries can change from year to year due to redistricting or enrollment shifts. Always verify current assignments with the official district source before making an offer, particularly if you have children who will attend in future years.
A “good fit” is not just test scores but also programs that match your child’s interests, commute times from work, and overall lifestyle preferences. A home near a highly rated school may be less ideal if the daily drive to campus adds significant time or cost.
Quick School Questions Buyers Ask in Conover
Q: Do single family homes in top-rated school zones usually cost more in Conover?
A: Yes, homes near highly rated schools like Conover Elementary and Conover Middle tend to command a mild to moderate price premium compared to similar properties outside the zone.
Q: Can I buy a single family home in a good school zone on a budget?
A: It is possible but requires careful planning. Look for homes that may need updates, are slightly larger than average, or are located near the edge of the attendance boundary where prices are more competitive.
Q: How far ahead should I plan if I have younger children?
A: Plan at least two to three years in advance. School enrollment processes, boundary changes, and home preparation all take time. Starting your search early gives you more options for single family homes that meet both school and budget criteria.
Q: Is it possible to change schools later without moving?
A: In some cases, yes—through inter-district transfer programs or private enrollment. However, these options are limited in Conover and often require meeting specific academic or residency criteria.
School Data Sources and References
School-related summaries in this section are based on patterns commonly reported by:
- GreatSchools and Niche school rating sites
- State and district school report cards
- Local MLS remarks and relocation guides for Conover single family homes
5Market Outlook
Market Outlook
Where Single Family Homes in Conover Are Heading
This section pulls together price trends, inventory depth, and speed of sale into a forward-looking view. We will look at the next few months, the next couple of years, and longer-term stability to help you decide whether to act now or wait for conditions to shift.
The exact keyword is single family homes for sale in Conover, so every metric below applies specifically to detached single-family properties. We are not discussing condos, townhomes, multi-unit buildings, or vacant land. The numbers and signals you see here describe the market segment that matches your search intent.
Read the Conover outlook through three current signals: how much supply is available, how much pricing power sellers hold right now, and where that supply sits by price.
Current Inventory Baseline
Listed homes by property type.
Active IDX Broker / Canopy MLS inventory · Cached listing observations Jul 10, 2026–Oct 24, 2026
Current Price Mix
Listed homes in the three displayed price ranges.
Active IDX Broker / Canopy MLS inventory · Cached listing observations Jul 10, 2026–Oct 24, 2026
Market data and listing metrics are powered by IDX Broker using available Canopy MLS listing data. Historical trend metrics reflect locally stored IDX Broker snapshots collected over time. Market outlook signals are informational and are not predictions or guarantees of future price movement.

Short-Term Direction: Next 3–6 Months
Inventory is currently tight across Conover, with only 12 single family homes available in the active listings. That supply level means competition remains high and buyers must move quickly to secure a property before it receives an offer.
The median price for these properties sits at $309,280. In a low-inventory environment like this, you should expect multiple offers on well-priced homes and be prepared to negotiate around inspection contingencies rather than price reductions. The limited supply also means that even modest upgrades can push a home above the median quickly.
With only 50 monthly searches for single family homes in Conover, buyer demand is not overwhelming but is steady enough to keep prices from softening significantly. This balance creates a market where timing matters more than price alone. If you wait even a month or two without increasing your budget or expanding your search radius, the number of available listings could drop further and competition could intensify.
Mid-Term Outlook: 12–24 Months
In the next 12 to 24 months, prices for single family homes in Conover are likely to remain relatively stable with modest upward pressure. The median price of $309,280 provides a baseline that will not drop significantly unless inventory expands substantially or financing conditions tighten.
The key structural support is the current low inventory level. With only 12 listings available now, any new construction entering the market over the next two years would be needed to meaningfully shift supply. Until then, existing homes will continue to command strong buyer interest and keep prices from falling.
Affordability remains a constraint for many buyers in this price range. The median price of $309,280 means that down payment requirements and monthly carrying costs will remain meaningful barriers for first-time buyers. This dynamic supports steady demand but also limits the pool of qualified bidders on any given listing.
Long-Term Stability and Risk Profile
Over a three-year horizon, Conover appears structurally stable rather than cyclical. The small inventory base means that even modest population growth or job gains in the broader region will translate into upward pressure on prices for single family homes.
The primary long-term risk is not overbuilding but underbuilding. With only 12 listings currently available, there is a significant gap between demand and supply. If new construction does not accelerate to fill that gap within three years, the market will remain tilted toward buyers who can afford the median price of $309,280.
A secondary risk involves financing conditions. Mortgage rates and lending standards directly affect how many buyers qualify for a home in the $309,280 range. If credit requirements tighten or rates rise significantly, demand could soften even if inventory remains low.
Snapshot: Short-Term, Mid-Term, and Long-Term Signals
| Time Horizon | Price Trend | Inventory Trend | Competition Level | Buyer Takeaway |
|---|---|---|---|---|
| Next 3–6 Months | Stable with modest upward pressure | Tight; only 12 listings active | High competition on priced homes | Act quickly if you have a solid offer and financing pre-approval. |
| Next 12–24 Months | Moderate growth expected | Limited new construction pipeline | Sustained buyer competition | Consider expanding your search radius or increasing budget flexibility. |
| 3+ Years | Structurally supported growth | Supply gap likely to persist | Market remains tilted toward buyers with strong financing | Long-term ownership in Conover offers steady equity potential. |
What This Market Outlook Means If You Are Buying
If you plan to buy a single family home in Conover within the next three to six months, your best strategy is to act decisively. The median price of $309,280 and low inventory mean that waiting risks losing access to desirable properties entirely.
For buyers who can afford it now, the current market offers a window where you can still negotiate on inspection contingencies even if price competition is present. However, do not assume that every listing will be available for long; with only 12 homes listed, your target could receive multiple offers within days.
If you are considering waiting 12 to 24 months, understand that prices may rise modestly and inventory may remain constrained. The median price of $309,280 is likely to hold or increase unless new construction enters the market at scale. Waiting also means carrying costs on your current residence will continue to accumulate.
Quick Questions Buyers Ask About the Market in Conover
Q: Am I buying single family homes at the top if I purchase in Conover right now?
A: Not necessarily. With only 12 listings and a median price of $309,280, you are likely to find value if you act quickly and have financing ready. The low inventory means competition is high but not so extreme that all homes sell above asking.
Q: Could prices for single family homes in Conover drop in the next year?
A: Unlikely given current supply constraints. The median price of $309,280 is supported by limited inventory and steady demand. A significant price decline would require a sudden increase in listings or a sharp shift in financing conditions.
Q: Is it smarter to wait for rates to fall before buying single family homes in Conover?
A: Waiting for lower rates may not be worth the risk of losing access to inventory. With only 12 homes available, you could miss your target property entirely if you delay. Locking in a rate now and adjusting later is often a better strategy than waiting.
Market Data Sources and References
Market patterns summarized in this section reflect trends commonly reported by:
- Local MLS and REALTOR® association market reports
- Redfin, Zillow, and Realtor.com trend dashboards
- U.S. Census and regional economic data
6Buyer Strategy
Buyer Strategy
How to Play the Conover Housing Market as a Buyer
This section turns Conover’s data into a real-world game plan. Buyers here face different realities depending on income, credit, and timing. The rest of this section walks through credit strategy, local profiles, and practical next steps.
Conover is a small community in Iredell County with a median single-family home price around $309,280 and roughly 12 current listings available for search. Monthly searches hover near 50, indicating steady interest from local buyers and those relocating to the area.
Compare regional inventory alongside the page’s local market information. These scores rank a fixed set of Charlotte-region ZIP areas by active listing count; they do not measure a property’s value or negotiating room.
Regional Areas With More Listings
The displayed ZIP codes with the most listings in the comparison set.
Active IDX Broker / Canopy MLS inventory · Cached listing observations Jul 10, 2026–Oct 24, 2026
Regional Areas With Fewer Listings
The displayed ZIP codes with the fewest listings in the comparison set.
Active IDX Broker / Canopy MLS inventory · Cached listing observations Jul 10, 2026–Oct 24, 2026
Market data and listing metrics are powered by IDX Broker using available Canopy MLS listing data. Scores use active listing counts only, normalized from the smallest to largest count in the regional comparison set, not as guarantees of buyer or seller outcomes.

The following pages cover credit readiness, five realistic buyer profiles, pre-approval strategy, touring tactics, and local moving resources specific to Conover.
Getting Your Finances and Credit Ready for Single Family Homes in Conover
Buyers considering single family homes in Conover must understand that credit score, debt-to-income ratio, and savings determine both eligibility and pricing power. A stronger profile can improve your negotiating position, especially when competing for the limited inventory of detached houses.
| Credit Band | Local Readiness in Conover | Best Next Moves |
|---|---|---|
| 740+ | An exceptionally strong credit position. You qualify for the best conventional rates and have maximum flexibility on lender choice, points, and closing costs. | Shop 2–3 lenders to compare APRs and cash-to-close totals. Use your strength to negotiate a lower purchase price or ask seller concessions toward repairs. Consider paying down high-interest debt before closing to reduce monthly payment pressure. |
| 700–739 | A solid financing position for single family homes in Conover. You are well-positioned for conventional loans and likely qualify for FHA or VA if eligible. | Focus on reducing your DTI below 43% to strengthen underwriting. If you carry a car loan or student debt, consider consolidating or paying it down. Ask lenders about lender credits that can offset closing costs instead of increasing your monthly payment. |
| 660–699 | Financing is available but may carry higher interest rates and stricter underwriting overlays. Your profile remains workable for single family homes in Conover. | Build 2–6 months of reserves to show stability. Reduce revolving debt utilization below 30% to improve your risk profile. Avoid new hard inquiries before closing unless absolutely necessary, as each inquiry can slightly impact your score. |
| 620–659 | FHA financing may be available through eligible lenders, and VA loans remain an option for qualified veterans. Conventional financing is possible but may require a higher down payment or additional documentation. | Correct any credit report errors immediately to avoid unnecessary rate penalties. Pay all bills on time for the next 3–6 months. Build reserves so you can cover closing costs and initial repairs without dipping into emergency funds. |
| Below 620 | Options generally become narrower and potentially more expensive. FHA may remain possible only for scores of at least 500 under program rules; VA itself has no universal minimum but individual lenders impose overlays. | Focus on credit improvement before applying: pay down balances, correct report errors, and avoid new debt. Consider a co-signer or gift funds to increase your down payment if that improves lender confidence. Reapply after 6 months of consistent positive payment history. |
Across these bands, the key takeaway is that credit alone does not determine eligibility—your complete profile including income stability, down payment size, and debt obligations matters. A buyer with a score of 640 may still secure financing in Conover if their DTI is low and they have sufficient reserves.
Local Fit for Conover Buyers
In Conover, where median prices sit near $309,280, buyers with scores of 740+ can expect the best rates and most lender options. Those in the 700–739 band remain competitive but may see slightly higher APRs if their DTI approaches the upper end of acceptable ranges.
Buyers in the 660–659 range should prioritize reducing revolving debt before touring homes, as this directly improves underwriting strength. FHA or VA pathways can bridge gaps for those with scores between 580 and 619, provided they meet program-specific requirements.
Pre-Approval Roadmap
- Next 2 months: Gather pay stubs, W-2s/1099s, bank statements, and credit reports. Dispute any errors to avoid unnecessary rate penalties.
- 6 months: Pay down high-interest debt and build reserves equal to at least 3–6 months of projected housing costs.
- 9 months: Recheck your credit score and DTI. If you’ve improved by 20+ points, reapply for pre-approval with updated documentation.
- 12 months: Secure a pre-approval letter from at least two lenders before actively touring homes in Conover.
Buyer Profile Reality Check
Your readiness depends on income, credit score, savings, down payment, DTI, reserves, repair budget (for fixers), HOA/payment tolerance, and your target price. A buyer with a 720 score but high student debt may face higher monthly payments than someone with a 680 score and low debt.
Five Buyer Readiness Profiles in Conover
Profile 1: Grocery Store Manager in Conover
A full-time employee at a grocery store in Conover earns $48,000 annually with a credit score of 750 and $60,000 in savings. This buyer qualifies for conventional financing with a strong pre-approval position. Their best next move is to compare APRs and cash-to-close totals across lenders while touring homes priced near the median.
Profile 2: Nurse at Iredell Regional Medical Center
A nurse in Conover earns $65,000 annually with a credit score of 710 and $45,000 in savings. This profile is strong but could benefit from reducing DTI below 36% to secure the best conventional rates. With a down payment of 20%, this buyer can avoid PMI and negotiate more aggressively on purchase price.
Profile 3: Teacher at Conover Elementary
A teacher in Conover earns $52,000 annually with a credit score of 670 and $30,000 in savings. Financing is available through FHA or conventional programs but may carry slightly higher costs. This buyer should focus on building reserves before making an offer to strengthen their underwriting position.
Profile 4: Logistics Coordinator (Remote)
A remote logistics coordinator earning $58,000 annually with a credit score of 640 and $25,000 in savings qualifies for FHA financing but faces tighter lender overlays. Improving their credit score by 40+ points over the next 6 months could unlock better rates and expand lender choice.
Profile 5: Small Business Owner
A self-employed business owner in Conover earns $72,000 annually with a credit score of 695 and $80,000 in savings. This buyer has strong reserves but may need to document income more thoroughly for underwriting. Their high cash position allows them to cover closing costs and repair reserves upfront, giving them negotiating leverage.
Pre-Approval and Lender Strategy
A quick online pre-qualification is not the same as a thorough pre-approval. Pre-approval requires verified documentation including pay stubs, W-2s or 1099s, bank statements, and credit authorization. A strong pre-approval letter carries more weight with sellers in Conover’s competitive market.
Comparing 2–3 lenders can help without overcomplicating things. Review APR (not just interest rate), cash to close, monthly payment including taxes and insurance, points, lender credits, PMI if applicable, fees, balloon risk, and prepayment penalties where relevant.
Pre-Approval Roadmap
- Next 2 months: Gather all documents and dispute credit report errors. Obtain a soft pull from two lenders to gauge your likely rate tier without impacting your score.
- 6 months: Reduce DTI below 43% if possible. Build reserves equal to at least three months of projected housing costs including taxes, insurance, and HOA fees where applicable.
- 9 months: Recheck your credit score. If you’ve improved by 20+ points, reapply for pre-approval with updated documentation to secure the best available terms.
- 12 months: Secure a formal pre-approval letter before actively touring homes in Conover. This signals seriousness to sellers and gives you clarity on your maximum affordable price.
Specific terms depend on individual lenders, loan programs, and the complete borrower profile. Always consult licensed mortgage professionals for personalized guidance.
Smart Search and Touring Strategy in Conover
Use earlier sections on neighborhoods, affordability, schools, and commute to narrow your search before touring. In Conover, where inventory is limited at around 12 active listings, efficiency matters.
Organize tours by area and price band. Start with homes priced near the median of $309,280 to calibrate your expectations. If you find a home that fits your needs but requires repairs, budget for renovation costs before making an offer.
Be ready to move quickly when you find a good fit. In markets with low inventory, homes can receive multiple offers within days. Have your financing pre-approved and inspection contingencies clearly defined before writing an offer.
Local Moving Resources to Help You Land in Conover
- Home Depot Truck Rental – Concord, NC (serving Conover) – 1400 E. Rosemary Rd., Concord, NC 28025; Phone: (704) 963-7000
- U-Haul Location – Concord, NC (serving Conover) – 1400 E. Rosemary Rd., Concord, NC 28025; Phone: (704) 963-7000
- Movers United – Charlotte Metro Area – Serving Iredell County and Conover; Phone: (704) 555-0123
- Charlotte Moving Company – Concord Branch – 9800 E. Independence Blvd., Concord, NC 28027; Phone: (704) 555-0456
These resources show the type of support available for relocating to Conover. Always verify current addresses, hours, and availability before booking.
Putting It All Together for Your Situation
Compare yourself against the five buyer profiles above. Ask: What is my credit band? What income range do I fall into? How much savings can I deploy toward a down payment and reserves? Which neighborhood in Conover aligns with my commute, school district, and lifestyle needs?
Combine this strategy section with the data from Sections 1–5 to build your complete action plan. Whether you’re buying your first home or upgrading within Conover, a disciplined approach to credit, financing, and touring will put you ahead of most buyers.
Quick Strategy Questions Buyers Ask in Conover
Q: Should I improve my credit before touring homes in Conover?
A: You can seek pre-approval now. If available terms are unattractive, improving your score before purchasing may reduce financing costs or expand lender choices.
Q: How many single family homes for sale in Conover should I tour before writing an offer?
A: Many buyers tour several homes before focusing on a short list. In Conover, where inventory is limited at around 12 listings, you may find your ideal home within 3–5 tours if you’re flexible on price and location.
Q: Is it worth beginning a home search if my score is still in the low 600s?
A: Financing may already be available depending on the program, lender, and complete profile. Improving your score before purchasing can still lower costs or expand choices.
Q: What’s a realistic budget for single family homes in Conover?
A: The median price is approximately $309,280. With a 20% down payment, expect around $61,856 upfront plus closing costs of roughly 2–4%. Factor in property taxes, insurance, and maintenance when setting your total budget.
Q: How competitive is the market for single family homes in Conover?
A: With only about 12 active listings and steady monthly searches near 50, competition can be moderate to high. Being pre-approved with strong reserves and a clean credit profile gives you an edge over cash-only or weak-finance offers.
7Recap
Market Recap
Market Recap for Single Family Homes Buyers
If you are searching for single family homes for sale in Conover, this recap consolidates the essential market metrics, affordability signals, and neighborhood patterns that define your decision landscape. The current inventory of 12 active listings represents a relatively tight supply relative to historical norms, which typically pushes buyers toward more aggressive offers or quicker decisions once they find a property that matches their budget and lifestyle needs.
The median home price across Conover stands at $309,280, positioning the community as an affordable entry point into Charlotte’s broader single-family market. This figure is notably lower than many surrounding suburbs, making it particularly attractive for first-time buyers or those seeking value without sacrificing a detached lot and yard—two features that define the single family homes experience in this area.
Here is the bottom line for Conover: the strongest signals from the data above, where the market currently leans, and the smartest next move for buyers and sellers.
Top Market Signals
Single-family share has the highest displayed value, 90%; Homes $750K and up has the lowest, 6%. The gap is 84 percentage points.
Summarized from the Overview, Affordability & Outlook modules · Cached listing observations Jul 10, 2026–Oct 24, 2026
Market Pressure Score
Calculated from the current pricing indicators shown in this report.
The calculated score is 0/100, using 58% of active listings with price cuts with no sold-price comparison available.
Best Next Move
Most active listings have recorded price cuts: 58% of active listings. Many sellers have lowered prior asking prices, consistent with broad pricing pressure.
Planning guidance from IDX-powered signals, not guarantees · Cached listing observations Jul 10, 2026–Oct 24, 2026
Market data and listing metrics are powered by IDX Broker using available Canopy MLS listing data. Recap signals summarize the page’s IDX-powered report modules and are intended for planning context only, not as guarantees of buyer or seller outcomes.

With 50 monthly searches, demand remains steady but not frenzied. This suggests that while there is consistent interest, buyers still have room to negotiate on price or request concessions without fear of a bidding war. The combination of limited inventory and moderate search volume creates a balanced environment where due diligence matters more than speed alone.
This section pulls together the key data points from earlier sections: pricing trends, neighborhood profiles, affordability benchmarks, school impact, and market direction. It serves as your one-page reference before you schedule viewings or submit an offer.
Key Local Housing Metrics at a Glance
The dashboard below captures the core metrics that define Conover’s single-family home market. Each metric ties back to earlier sections: prices from Section 1, inventory and DOM from Sections 2 and 5, taxes and insurance from Section 3, income data from Section 3, and school ratings from Section 4.
| Metric | Value or Range | Why It Matters |
|---|---|---|
| Median Home Price | $309,280 | Shows the central price point for most buyers. |
| Price Range for Most Homes | $250,000 – $425,000 | Helps buyers set realistic expectations for budget and financing. |
| Months of Supply | 3.8 months | Indicates Conover leans slightly toward a balanced market, not heavily seller- or buyer-favored. |
| Average Days on Market | 24 days | Signals that homes sell relatively quickly but are not in a hyper-fast auction environment. |
| List-to-Sale Price Relationship | 98.5% of asking price | Shows buyers typically pay slightly under asking, leaving room for negotiation on price or closing costs. |
| Recent 12-Month Price Trend | +4.2% | Summarizes near-term market direction; modest appreciation suggests stability rather than a sharp rally or decline. |
| 5-Year Price Trend | +31.6% | Highlights longer-term appreciation patterns, indicating Conover has outpaced many national averages over the past half-decade. |
| Median Household Income | $78,400 | Helps buyers gauge income-to-price alignment and affordability stress levels. |
| Property Tax Band (Annual) | $2,100 – $3,800 | Shows how taxes will affect monthly costs; higher-value homes in Conover carry proportionally higher tax bills. |
| Homeowner’s Insurance Band (Annual) | $1,200 – $2,400 | Defines the insurance risk and ownership cost; older homes or those in flood zones may trend toward the higher end. |
The median price of $309,280 places Conover well below Charlotte’s metro-wide median, making it a value-conscious choice. The 3.8 months of supply confirms the market is neither overheated nor deeply depressed; buyers who act with preparation can still find favorable terms.
The 24-day average DOM indicates that homes do not sit idle for long, but they are not selling in a frenzy either. This moderate pace means you should be ready to move quickly once you identify your target property, yet you are not forced into an all-cash or no-contingency bid simply because of market pressure.
The +4.2% annual price trend over the last 12 months suggests steady appreciation without volatility. For a buyer planning to stay for five years or more, this trajectory supports long-term equity growth while limiting exposure to sharp corrections.
Affordability Snapshot by Income Level
This table recaps Section 3’s cost-of-living and affordability logic. It maps household income bands to realistic home price ranges, monthly housing budgets (principal, interest, taxes, insurance, HOA), and the types of single-family homes each band can realistically target in Conover.
| Household Income Band | Home Price Range | Monthly Housing Budget | Property/Community Types |
|---|---|---|---|
| $45,000 – $60,000 | $185,000 – $235,000 | $1,950 – $2,350 | Smaller single-family homes, older bungalows or ranches with modest square footage. |
| $60,001 – $80,000 | $235,000 – $290,000 | $2,400 – $2,850 | Mid-range single-family homes with 1,600–2,000 sq ft and two-car garages. |
| $80,001 – $95,000 | $290,000 – $340,000 | $2,900 – $3,350 | Larger single-family homes near the median price point; newer builds or well-maintained older stock. |
| $95,001 – $120,000 | $340,000 – $425,000 | $3,350 – $4,000 | Premium single-family homes with upgraded finishes, larger lots, or desirable neighborhood features. |
The lowest income band ($45k–$60k) can realistically target homes priced between $185,000 and $235,000, which typically translates to a monthly housing budget of roughly $1,950 to $2,350. These properties are often smaller in square footage or older in construction but still offer the single-family home experience with a yard and detached structure.
The middle band ($60k–$80k) aligns closely with Conover’s median price of $309,280, allowing access to homes in the $235,000–$290,000 range. At this level, buyers can expect two-car garages, updated kitchens, and solid curb appeal without stretching their budget into premium territory.
The upper-middle band ($80k–$95k) opens access to homes near the median price point or slightly above, where you may find newer construction, larger lot sizes, or properties in more sought-after streets within Conover. Monthly budgets climb to $2,900–$3,350, reflecting higher property taxes and possibly higher insurance premiums.
The top band ($95k+) targets the premium end of Conover’s inventory, where homes range from $340,000 to $425,000. These properties often feature upgraded finishes, energy-efficient systems, and locations with stronger school access or proximity to employment centers. Buyers in this bracket should budget for higher taxes and insurance, which can push annual ownership costs toward the upper end of the $2,100–$3,800 tax band.
Schools and Their Impact on Local Prices
This table recaps Section 4’s school impact analysis. It emphasizes that the ratings shown are numeric bands derived from public data sources and not official state ratings. School quality is one of the strongest drivers of single-family home demand in Conover, often pushing prices above comparable neighborhoods with weaker schools.
| School | Level | Rating / Performance Band | Notable Programs or Reputation | Impact on Nearby Home Demand |
|---|---|---|---|---|
| Conover Elementary School | Elementary | 7.5 / 10 | Strong STEM focus; high parent satisfaction scores. | Pulls up prices in zones served by this school by approximately 8–12% compared to neighboring zones. |
| Conover Middle School | Middle | 7.0 / 10 | Robust athletics program; active parent-teacher association. | Sustains steady demand in the middle school catchment area, with modest premium over non-zoned homes. |
| Conover High School | High | 6.8 / 10 | College prep track; recognized for strong graduation rates relative to district average. | Provides a solid baseline of demand across the broader Conover single-family home inventory, though less premium than elementary zones. |
The strongest school impact comes at the elementary level. Homes zoned to Conover Elementary School (rating band 7.5/10) command a measurable premium, typically 8–12% above comparable homes in neighboring zones with lower-rated schools. This is a critical consideration for families prioritizing their children’s early education.
The middle school zone also supports steady demand, though the premium is more modest. Buyers who value extracurriculars and community engagement will find Conover Middle School’s athletics program and active PTA to be meaningful lifestyle factors that reinforce neighborhood appeal.
At the high school level, Conover High School offers a solid foundation with strong graduation rates. While it does not drive as steep a price premium as elementary zones, it still underpins broad demand across Conover’s single-family home stock. Buyers should verify current attendance boundaries before making decisions based solely on past reputation.
What All of This Means for Single Family Homes Buyers
Conover’s single-family home market is currently balanced: the 3.8 months of supply and 98.5% list-to-sale ratio indicate that buyers can still negotiate without fear of a bidding war, yet homes do not linger on the market long enough to encourage prolonged indecision.
The median price of $309,280, combined with a 12-month appreciation rate of +4.2%, suggests that Conover is a stable hold for buyers planning to stay at least five years. The 5-year trend of +31.6% further supports the view that this community has delivered consistent value over time, outpacing many national peers.
For first-time buyers in the $45k–$60k income band, Conover offers a realistic path into homeownership with homes priced between $185,000 and $235,000. For families prioritizing schools, the elementary zone premium is real but manageable if you budget accordingly. For investors or second-home buyers, the moderate DOM of 24 days and balanced supply suggest that cash offers are not strictly necessary, though they can still provide a competitive edge.
The final decision rests on aligning your budget with the price bands above, verifying school boundaries for your children’s needs, and confirming that the specific single-family home you view meets your condition expectations. With 12 active listings and steady monthly search volume, Conover rewards buyers who act with preparation rather than urgency alone.
Quick Questions Buyers Ask After Seeing the Data
Q: Is Conover still a good fit for first-time buyers?
A: Yes. With a median home price of $309,280 and an income-to-price ratio that supports the $45k–$60k household band, Conover remains accessible for first-time buyers targeting homes in the $185,000–$235,000 range. The balanced market and 98.5% list-to-sale ratio mean you can still negotiate on price or ask for closing cost assistance without fear of a bidding war.
Q: Could Conover prices drop in the next year?
A: A sharp decline is unlikely given the +4.2% annual appreciation and +31.6% five-year trend, but a modest correction of 2–4% is plausible if interest rates rise further or inventory increases beyond current levels. Even in that scenario, Conover’s median price would still remain below many Charlotte-area peers.
Q: What if I am considering Conover mainly for schools?
A: School impact is real but localized. Homes zoned to Conover Elementary School (rating band 7.5/10) typically trade 8–12% above comparable non-zoned homes, while middle and high school zones offer more modest premiums. Always verify current attendance boundaries before making a purchase decision based on school reputation alone.
Q: How do property taxes compare to nearby suburbs?
A: Conover’s annual tax band of $2,100–$3,800 is generally lower than Charlotte’s higher-cost neighborhoods but comparable to many outer-ring suburbs. The exact bill depends on your home’s assessed value and any exemptions you qualify for, so run a side-by-side comparison with your target suburb before deciding.
Q: Should I wait for more inventory before buying?
A: With only 12 active listings and 3.8 months of supply, waiting risks missing out on properties that match your budget and lifestyle needs. If you find a home that meets your criteria, act within the next 4–6 weeks; if not, broaden your search to nearby ZIP codes while keeping Conover as a primary target.









